Exam 1: Describing Data: Graphical
Exam 1: Describing Data: Graphical247 Questions
Exam 2: Describing Data: Numerical326 Questions
Exam 3: Probability345 Questions
Exam 4: Discrete Random Variables and Probability Distributions257 Questions
Exam 5: Continuous Random Variables and Probability Distributions239 Questions
Exam 6: Sampling and Sampling Distributions147 Questions
Exam 7: Estimation: Single Population151 Questions
Exam 8: Estimation: Additional Topics109 Questions
Exam 9: Hypothesis Testing: Single Population164 Questions
Exam 10: Hypothesis Testing: Additional Topics103 Questions
Exam 11: Simple Regression217 Questions
Exam 12: Multiple Regression252 Questions
Exam 13: Additional Topics in Regression Analysis168 Questions
Exam 14: Analysis of Categorical Data241 Questions
Exam 15: Analysis of Variance192 Questions
Exam 16: Time-Series Analysis and Forecasting138 Questions
Exam 17: Additional Topics in Sampling110 Questions
Select questions type
The procedure used to select a sample of objects from a population in a way that each member of the population is chosen strictly by chance and is equally likely to be chosen is called:
(Multiple Choice)
4.8/5  (42)
(42)
A summary measure that is computed from a sample to describe a characteristic of the population is known as a(n):
(Multiple Choice)
4.8/5 (39)
THE NEXT QUESTIONS ARE BASED ON THE FOLLOWING INFORMATION:
The Quality Assurance Department of a large restaurant is attempting to monitor and evaluate customer satisfaction with restaurant services.Prior to their departure,a random sample of customers is asked to fill out a short questionnaire to rate such services as quality of food,price,waiting time to be served,and cleanliness of the place.The Quality Assurance Department prepares weekly reports that are used to improve the services.
-In this restaurant services study,a listing of all customers in this restaurant over a particular week would constitute a:
(Multiple Choice)
4.9/5 (41)
Anita collected a data set on the weights (to the nearest pounds)of all students at her university.The best graph to describe this data is a:
(Multiple Choice)
4.8/5 (39)
The length of time it takes to assemble a particular electronic component varies from one employee to another.Management has collected the time (in minutes)it took 20 different employees to assemble the component.The information is summarized in the following frequency distribution generated by Excel: 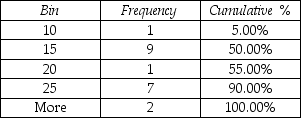 Which of the following statements is true?
(Multiple Choice)
4.9/5 (38)
THE NEXT QUESTIONS ARE BASED ON THE FOLLOWING INFORMATION:
Percentage returns for the 25 largest U.S.common stock mutual funds for a particular day are displayed below.
 -Construct a histogram to describe the data.
(Essay)
4.8/5 (33)
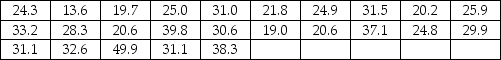
THE NEXT QUESTIONS ARE BASED ON THE FOLLOWING INFORMATION:
The time (in hours)that a sample of 20 students studied for a statistics test are shown below
 -Construct a frequency distribution of the data.
(Essay)
4.9/5 (43)
The relative frequency in a class is obtained by dividing the frequency in that class by the total number of observations.
(True/False)
4.9/5 (31)
THE NEXT QUESTIONS ARE BASED ON THE FOLLOWING INFORMATION:
The head of human resources at a corporation with 100 employees was curious about levels of employment by classification.She determined that 10% of all employees were classified as executive,15% as professional,25% as clerical and janitorial,30% as administrative and 20% as technical workers:
-Construct a bar chart to show this information.
(Essay)
4.8/5 (37)
Quantitative variables usually represent membership in groups or categories.
(True/False)
4.9/5 (39)
THE NEXT QUESTIONS ARE BASED ON THE FOLLOWING INFORMATION:
A paper company is interested in estimating the proportion of trees in a 600-acre forest with diameters exceeding 2 feet.The company selects 30 plots (100 feet by 100 feet)from the forest and utilizes the information from the 30 plots to help estimate the proportion for the whole forest.
-What statistical term describes the 30 plots?
(Essay)
4.8/5 (33)
THE NEXT QUESTIONS ARE BASED ON THE FOLLOWING INFORMATION:
Data were collected on the number of people entering an electronics store each hour.The data are presented below.
 -Construct cumulative frequency and cumulative percent distributions of the data.
(Essay)
4.9/5 (31)
The calendar year is an example of an interval scale of measurement.
(True/False)
4.9/5 (43)
THE NEXT QUESTIONS ARE BASED ON THE FOLLOWING INFORMATION:
The data presented below were collected on the amount of time,in hours;it takes an employee,to process an order at a local plumbing wholesaler.
 -Construct a stem-and-leaf display of the data.
(Essay)
4.7/5 (46)
A company employs 750 individuals.To ascertain how the employees feel regarding a pension plan,75 of the employees are surveyed.The proportion of the 75 employees who favor the pension plan is a parameter.
(True/False)
4.8/5 (39)
If the observations are not symmetrically distributed on either side of its center,the histogram is said to be:
(Multiple Choice)
4.9/5 (40)
Descriptive statistics is a process,not just a numerical result.This process might include estimation,hypothesis testing,analysis of relationships,or forecasting.
(True/False)
5.0/5 (44)
Filters
- Essay(0)
- Multiple Choice(0)
- Short Answer(0)
- True False(0)
- Matching(0)