Exam 1: Describing Data: Graphical
Exam 1: Describing Data: Graphical247 Questions
Exam 2: Describing Data: Numerical326 Questions
Exam 3: Probability345 Questions
Exam 4: Discrete Random Variables and Probability Distributions257 Questions
Exam 5: Continuous Random Variables and Probability Distributions239 Questions
Exam 6: Sampling and Sampling Distributions147 Questions
Exam 7: Estimation: Single Population151 Questions
Exam 8: Estimation: Additional Topics109 Questions
Exam 9: Hypothesis Testing: Single Population164 Questions
Exam 10: Hypothesis Testing: Additional Topics103 Questions
Exam 11: Simple Regression217 Questions
Exam 12: Multiple Regression252 Questions
Exam 13: Additional Topics in Regression Analysis168 Questions
Exam 14: Analysis of Categorical Data241 Questions
Exam 15: Analysis of Variance192 Questions
Exam 16: Time-Series Analysis and Forecasting138 Questions
Exam 17: Additional Topics in Sampling110 Questions
Select questions type
THE NEXT QUESTIONS ARE BASED ON THE FOLLOWING INFORMATION:
A statistics professor has developed the cross table presented below,that compares students' class standing with their final grades.
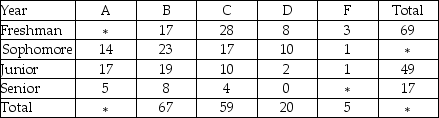 -Calculate the missing values identified by asterisks.What patterns do you see in this table?
(Essay)
4.8/5  (37)
(37)
Describe systematic sampling.Use a sample size of 50 and a population of 500 names in alphabetical order.
(Essay)
4.8/5 (30)
A researcher randomly picks the first item or subject from a population,N then selects each jth subject where j is the ratio of the population size,N to the desired sample size,n.In this case,the researcher is using:
(Multiple Choice)
4.9/5 (40)
THE NEXT QUESTIONS ARE BASED ON THE FOLLOWING INFORMATION:
At New York State University,800 students are randomly selected and asked the distance of their commute to campus.From this group a mean of 14.6 miles is computed.
-What is the population?
(Essay)
4.8/5 (40)
THE NEXT QUESTIONS ARE BASED ON THE FOLLOWING INFORMATION:
A recent study examined the intended travel destinations for a sample of 100 residents from Grand Rapids,Michigan.The respondents indicated the likely destination of their next vacation.The results of this survey are as follows: 8% were contemplating an international trip,16% were considering Florida,30% said they would go to California,36% thought they would go somewhere within Michigan,and the remaining 10% were looking at some other destination.
-Construct a pie chart to show this information.
(Essay)
4.8/5 (35)
You asked ten of your classmates about their weight.On the basis of this information,you stated that the average weight of all students in your university or college is 142.6 pounds.This is an example of:
(Multiple Choice)
4.8/5 (40)
When data are collected in a statistical study for only a portion or subset of all elements of interest the researcher is using a:
(Multiple Choice)
4.8/5 (42)
Your high school graduating class rank is an example of an ordinal scale.
(True/False)
4.9/5 (37)
THE NEXT QUESTIONS ARE BASED ON THE FOLLOWING INFORMATION:
An investment advisor recently reviewed the account activity of a sample of 10 of his clients and calculated the average number of stock trades per month over the past year for each client.He obtained the following data values: 10.2,2.5,11.4,3.2,1.1,3.4,8.4,9.7,11.2,and 2.4.
-Construct a cumulative relative frequency and cumulative percent distributions of the data.
(Essay)
4.8/5 (39)
THE NEXT QUESTIONS ARE BASED ON THE FOLLOWING INFORMATION:
In a recent marketing experiment,consumers were given one of four different types of dishwashing detergent and asked to use it for a month.At the end of that time they were asked to rate the detergent in terms of overall quality.The results are presented below.
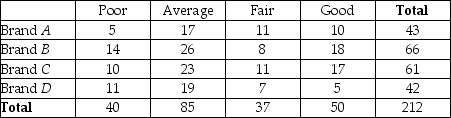 -What percentage of the consumers rated their detergent fair or good?
(Multiple Choice)
4.9/5 (39)
Systematic sampling is the random selection of an infinite number of samples from a population.
(True/False)
4.8/5 (41)
One manner in which to bring attention to data summarized in a table showing relative frequencies is by the use of a:
(Multiple Choice)
4.8/5 (42)
The scatter plot visually shows the relationship between two variables.
(True/False)
4.8/5 (39)
If you want to be 80% sure you did not get your valentine something unwanted,what should you avoid buying? How does the Pareto diagram show this?
(Essay)
4.9/5 (30)
Find the cumulative % through Bend,and explain what that value means.
(Essay)
4.8/5 (30)
THE NEXT QUESTIONS ARE BASED ON THE FOLLOWING INFORMATION:
An office supply warehouse has boxes of pencils,100 pencils to the box.Information about the entire warehouse as well as a sample of the boxes is shown below:
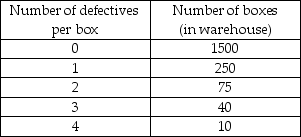 -Describe the population.
(Essay)
4.8/5 (37)
Filters
- Essay(0)
- Multiple Choice(0)
- Short Answer(0)
- True False(0)
- Matching(0)