Exam 1: Describing Data: Graphical
Exam 1: Describing Data: Graphical247 Questions
Exam 2: Describing Data: Numerical326 Questions
Exam 3: Probability345 Questions
Exam 4: Discrete Random Variables and Probability Distributions257 Questions
Exam 5: Continuous Random Variables and Probability Distributions239 Questions
Exam 6: Sampling and Sampling Distributions147 Questions
Exam 7: Estimation: Single Population151 Questions
Exam 8: Estimation: Additional Topics109 Questions
Exam 9: Hypothesis Testing: Single Population164 Questions
Exam 10: Hypothesis Testing: Additional Topics103 Questions
Exam 11: Simple Regression217 Questions
Exam 12: Multiple Regression252 Questions
Exam 13: Additional Topics in Regression Analysis168 Questions
Exam 14: Analysis of Categorical Data241 Questions
Exam 15: Analysis of Variance192 Questions
Exam 16: Time-Series Analysis and Forecasting138 Questions
Exam 17: Additional Topics in Sampling110 Questions
Select questions type
The stem-and-leaf display for summarizing numerical data is a combination of a graphic technique and a sorting technique.
(True/False)
4.8/5  (42)
(42)
Determine the percentage of time it takes an employee at most 12.5 hours to process an order at the plumbing wholesaler.
(Essay)
4.8/5 (35)
When a variable is measured,a numerical value code is assigned to it,and the result will be in one of four levels of measurement - nominal,ordinal,interval,or ratio.
(True/False)
4.8/5 (37)
A professor is looking for a volunteer for a project.She chooses a number between 00 and 99.The student whose phone number has the last two digits closest to the one the professor has chosen is selected.This is an example of a simple random sample.
(True/False)
4.9/5 (35)
THE NEXT QUESTIONS ARE BASED ON THE FOLLOWING INFORMATION:
In a recent marketing experiment,consumers were given one of four different types of dishwashing detergent and asked to use it for a month.At the end of that time they were asked to rate the detergent in terms of overall quality.The results are presented below.
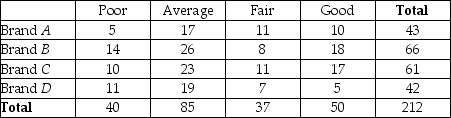 -Of the customers who were given Brand A,what percentage rated it poor?
(Multiple Choice)
4.8/5 (46)
A recent Wall Street Journal poll asked a group of American voters to rate economic conditions in the United States.92% of the respondents rated economic conditions as "unfavorable." Identify the population,sample,sample statistic,and population parameter in this survey.
(Essay)
4.8/5 (36)
Inferential statistics is the study and description of data that result from an experiment.
(True/False)
4.9/5 (29)
Dimensional characteristics,such as height,are an example of a:
(Multiple Choice)
4.8/5 (41)
THE NEXT QUESTIONS ARE BASED ON THE FOLLOWING INFORMATION:
In a recent marketing experiment,consumers were given one of four different types of dishwashing detergent and asked to use it for a month.At the end of that time they were asked to rate the detergent in terms of overall quality.The results are presented below.
-What percentage of the consumers rated their detergent average or better?
(Multiple Choice)
4.9/5 (35)
In a frequency distribution,what is the number of observations in a class called?
(Multiple Choice)
4.8/5 (42)
THE NEXT QUESTIONS ARE BASED ON THE FOLLOWING INFORMATION:
The data presented below were collected on the amount of time,in hours;it takes an employee,to process an order at a local plumbing wholesaler.
 -Construct a frequency histogram of the data.
(Essay)
4.9/5 (34)
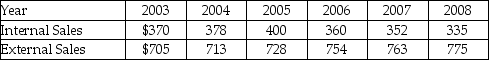
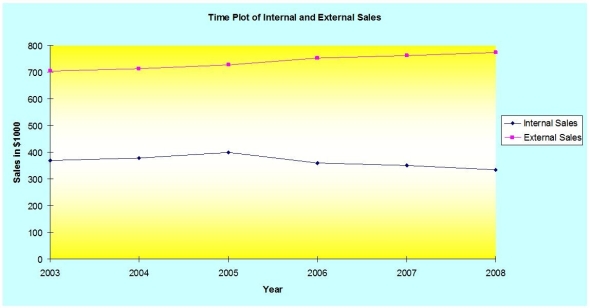
The sales manager for a local commercial waste disposal company has tracked the yearly dollar value (in $1000)of contracts made by both internal sales people and external sales people.The data are presented below.Graph the data with a time plot.What possible conclusions or actions might the firm consider?
(Essay)
4.8/5 (37)
The type of variables which produce responses that belong to groups or categories,such as responses to yes or no questions,are called:
(Multiple Choice)
4.9/5 (30)
A time-series plot is considered a pie chart that displays the relative frequency of defect causes and is used to separate the "vital few" from the "trivial many"
(True/False)
5.0/5 (32)
Which of the following statements about a pie chart is false?
(Multiple Choice)
4.9/5 (30)
If the sample is a good representation of the population,what percentage of those who spent the weekend studying should we expect to do poorly on the final exam?
(Essay)
4.8/5 (35)
Descriptive statistics is the study of a sample that enables a researcher to make projections or estimates about the population from which the sample is drawn.
(True/False)
4.8/5 (37)
Consider the following frequency distribution generated by Excel.What is the missing frequency value identified by the asterisk? 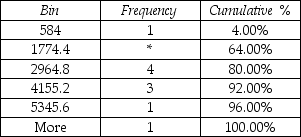
(Multiple Choice)
4.7/5 (39)
Filters
- Essay(0)
- Multiple Choice(0)
- Short Answer(0)
- True False(0)
- Matching(0)