Exam 1: Describing Data: Graphical
Exam 1: Describing Data: Graphical247 Questions
Exam 2: Describing Data: Numerical326 Questions
Exam 3: Probability345 Questions
Exam 4: Discrete Random Variables and Probability Distributions257 Questions
Exam 5: Continuous Random Variables and Probability Distributions239 Questions
Exam 6: Sampling and Sampling Distributions147 Questions
Exam 7: Estimation: Single Population151 Questions
Exam 8: Estimation: Additional Topics109 Questions
Exam 9: Hypothesis Testing: Single Population164 Questions
Exam 10: Hypothesis Testing: Additional Topics103 Questions
Exam 11: Simple Regression217 Questions
Exam 12: Multiple Regression252 Questions
Exam 13: Additional Topics in Regression Analysis168 Questions
Exam 14: Analysis of Categorical Data241 Questions
Exam 15: Analysis of Variance192 Questions
Exam 16: Time-Series Analysis and Forecasting138 Questions
Exam 17: Additional Topics in Sampling110 Questions
Select questions type
THE NEXT QUESTIONS ARE BASED ON THE FOLLOWING INFORMATION:
The time (in hours)that a sample of 20 students studied for a statistics test are shown below
 -Construct a stem-and-leaf display for the data
(Essay)
4.8/5  (36)
(36)
THE NEXT QUESTIONS ARE BASED ON THE FOLLOWING INFORMATION:
Suppose you own a DVD rental store.
-Give an example of a question that could be answered using descriptive statistics.
(Essay)
4.8/5 (46)
If three possible values of a variable represent distinct categories of similar objects or events,the variable is referred to as a:
(Multiple Choice)
4.8/5 (32)
Suppose a survey is taken of 300 high school seniors out of a total of 1,000 seniors.This group is probably a:
(Multiple Choice)
4.8/5 (41)
THE NEXT QUESTIONS ARE BASED ON THE FOLLOWING INFORMATION:
The Quality Assurance Department of a large restaurant is attempting to monitor and evaluate customer satisfaction with restaurant services.Prior to their departure,a random sample of customers is asked to fill out a short questionnaire to rate such services as quality of food,price,waiting time to be served,and cleanliness of the place.The Quality Assurance Department prepares weekly reports that are used to improve the services.
-In this restaurant services study,the process of using sample information for predictions,forecasts,and estimates is called:
(Multiple Choice)
4.7/5 (44)
A statistic is a descriptive measure computed from an entire population.
(True/False)
4.7/5 (36)
If the sample is a good representation of the population,what percentage of those who did poorly on the final exam should we expect to have spent the weekend studying?
(Essay)
4.9/5 (36)
A more serious error resulting from errors in the kind of sampling procedure used is called a(n):
(Multiple Choice)
4.9/5 (35)
Association of Tennis Professionals (ATP)singles rankings for tennis players is an example of an interval scale.
(True/False)
4.9/5 (36)
Histograms may not be "mathematically correct" since they often cannot be scaled on the vertical axis.
(True/False)
4.8/5 (36)
THE NEXT QUESTIONS ARE BASED ON THE FOLLOWING INFORMATION:
At New York State University,800 students are randomly selected and asked the distance of their commute to campus.From this group a mean of 14.6 miles is computed.
-What is the statistic?
(Essay)
4.8/5 (43)
A company has developed a new battery,but the average lifetime is unknown.In order to estimate this average,a sample of 110 batteries is tested and the average lifetime of this sample is found to be 200 hours.The 200 hours is the value of a:
(Multiple Choice)
4.8/5 (33)
A sample is the complete set of elements in which an investigator is interested.
(True/False)
4.8/5 (34)
A quality control inspector is interested in the number of boxes with more than two defectives.What is the value of the parameter?
(Essay)
4.9/5 (53)
In rating the service provided by a restaurant server,the following responses are possible: excellent,above average,average,below average,and poor.The responses are coded from 1 to 5 with 5 being excellent.The level of measurement this scale represents is:
(Multiple Choice)
4.9/5 (35)
THE NEXT QUESTIONS ARE BASED ON THE FOLLOWING INFORMATION: 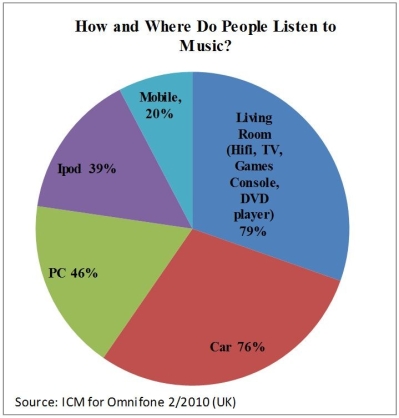 -Where is most music listened to?
(Multiple Choice)
4.9/5 (31)
What percentage of the students in the sample went partying the weekend before the final exam and did poorly on the exam?
(Essay)
4.9/5 (43)
THE NEXT QUESTIONS ARE BASED ON THE FOLLOWING INFORMATION:
Data were collected on the number of people entering an electronics store each hour.The data are presented below.
 -Construct a frequency distribution of the data.
(Essay)
4.9/5 (41)
Filters
- Essay(0)
- Multiple Choice(0)
- Short Answer(0)
- True False(0)
- Matching(0)