Exam 1: Describing Data: Graphical
Exam 1: Describing Data: Graphical247 Questions
Exam 2: Describing Data: Numerical326 Questions
Exam 3: Probability345 Questions
Exam 4: Discrete Random Variables and Probability Distributions257 Questions
Exam 5: Continuous Random Variables and Probability Distributions239 Questions
Exam 6: Sampling and Sampling Distributions147 Questions
Exam 7: Estimation: Single Population151 Questions
Exam 8: Estimation: Additional Topics109 Questions
Exam 9: Hypothesis Testing: Single Population164 Questions
Exam 10: Hypothesis Testing: Additional Topics103 Questions
Exam 11: Simple Regression217 Questions
Exam 12: Multiple Regression252 Questions
Exam 13: Additional Topics in Regression Analysis168 Questions
Exam 14: Analysis of Categorical Data241 Questions
Exam 15: Analysis of Variance192 Questions
Exam 16: Time-Series Analysis and Forecasting138 Questions
Exam 17: Additional Topics in Sampling110 Questions
Select questions type
A pie chart typically depicts the proportion of frequencies in each category.
(True/False)
4.9/5  (37)
(37)
In real life,there aren't any situations in which we need to describe relationships between categorical or ordinal variables.
(True/False)
4.9/5 (39)
What is the difference between a frequency distribution and a relative frequency distribution?
(Essay)
4.8/5 (36)
One possible error in constructing a histogram is to make the heights of the rectangles,and not the areas of the rectangles,proportional to the frequencies.
(True/False)
4.9/5 (43)
An audit of accounts receivable will generally be based on a population.
(True/False)
4.9/5 (47)
What percentage of the students in the sample spent the weekend studying and did well in the final exam?
(Essay)
4.9/5 (41)
Descriptive statistics are used to make a forecast regarding future trends.
(True/False)
4.8/5 (40)
Consider the following frequency distribution generated by Excel.What proportion of these values are less than 63? 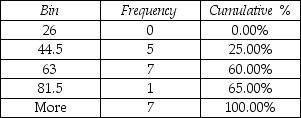
(Multiple Choice)
4.7/5 (30)
An automobile insurance agent believes that company A is more reliable than company B.Which level of measurement does this information represent?
(Multiple Choice)
4.8/5 (38)
A quality control inspector is interested in the proportion of boxes with no more than one defective pencil.What is the value of the parameter?
(Essay)
4.8/5 (40)
The data in the time-series plot below represents monthly sales for two years of beanbag animals at a local retail store (Month 1 represents January and Month 12 represents December).Do you see any obvious patterns in the data? Explain. 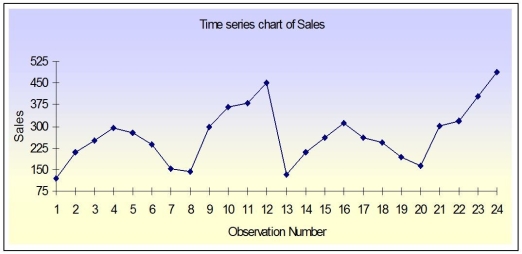
(Essay)
4.9/5 (40)
THE NEXT QUESTIONS ARE BASED ON THE FOLLOWING INFORMATION:
In a recent marketing experiment,consumers were given one of four different types of dishwashing detergent and asked to use it for a month.At the end of that time they were asked to rate the detergent in terms of overall quality.The results are presented below.
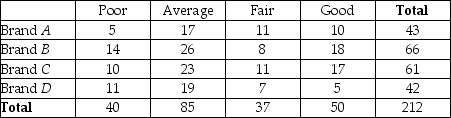 -What percentage of the consumers evaluated Brand A?
(Multiple Choice)
4.9/5 (35)
Making the heights of the bars but not the areas in a histogram proportional to the frequencies provides for a(n):
(Multiple Choice)
4.8/5 (34)
The larger the number of observations in a numerical data set,the smaller the number of class intervals needed for constructing a grouped frequency distribution.
(True/False)
4.8/5 (42)
Which of the following is the graphical analog of a frequency table?
(Multiple Choice)
4.9/5 (36)
A businessman who is running for the vacant Mayoral seat with 88,000 registered voters conducts a survey.In the survey,54.6% of the 1,200 registered voters interviewed say they planned to vote for him.Identify the population of interest and the sample in this survey.
(Essay)
4.8/5 (36)
THE NEXT QUESTIONS ARE BASED ON THE FOLLOWING INFORMATION:
A sample of 150 students at a State University was taken after the final business statistics exam to ask them whether they went partying the weekend before the final or spent the weekend studying,and whether they did well or poorly on the final.The following table contains the result.
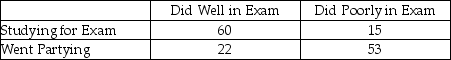 -Of those in the sample who did well on the final exam,what percentage of them went partying the weekend before the exam?
(Essay)
4.7/5 (38)
Identify the shape of the distribution of the following histograms as:
Symmetric distribution;Skewed-right distribution;or Skewed-left distribution
A. 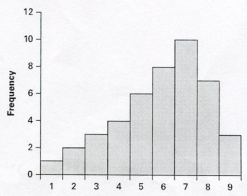 B.
B. 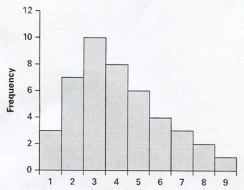 C.
C. 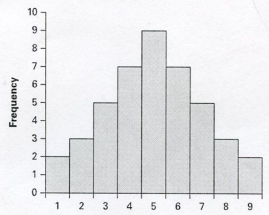
(Essay)
4.8/5 (29)
The table which lists the number of observations for every combination of values for two categorical or ordinal variables is called a:
(Multiple Choice)
4.8/5 (40)
A company has determined that there are seven possible defects for one of its product lines.Construct a Pareto diagram for the following defect frequencies:
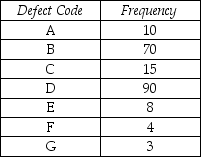
(Essay)
4.9/5 (43)
Filters
- Essay(0)
- Multiple Choice(0)
- Short Answer(0)
- True False(0)
- Matching(0)