Exam 1: Describing Data: Graphical
Exam 1: Describing Data: Graphical247 Questions
Exam 2: Describing Data: Numerical326 Questions
Exam 3: Probability345 Questions
Exam 4: Discrete Random Variables and Probability Distributions257 Questions
Exam 5: Continuous Random Variables and Probability Distributions239 Questions
Exam 6: Sampling and Sampling Distributions147 Questions
Exam 7: Estimation: Single Population151 Questions
Exam 8: Estimation: Additional Topics109 Questions
Exam 9: Hypothesis Testing: Single Population164 Questions
Exam 10: Hypothesis Testing: Additional Topics103 Questions
Exam 11: Simple Regression217 Questions
Exam 12: Multiple Regression252 Questions
Exam 13: Additional Topics in Regression Analysis168 Questions
Exam 14: Analysis of Categorical Data241 Questions
Exam 15: Analysis of Variance192 Questions
Exam 16: Time-Series Analysis and Forecasting138 Questions
Exam 17: Additional Topics in Sampling110 Questions
Select questions type
The students at a small community college in Iowa apply to study either English or Business.Some administrators at the college are concerned that women are being discriminated against in being allowed admittance,particularly in the business program.Below,you will find two contingency tables that show the percentage of students admitted by gender to the English program and the Business school.The data has also been presented graphically.What do the data and graphs indicate? 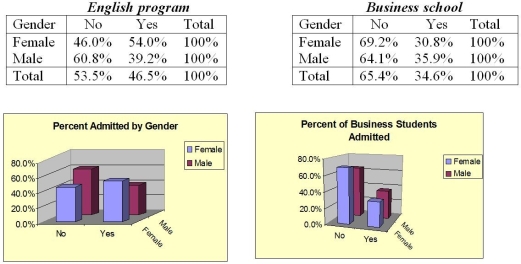
(Essay)
4.9/5  (43)
(43)
A scatter plot usually doesn't indicate whether extreme values exist in the data.
(True/False)
4.8/5 (43)
A line graph that connects points that represent the cumulative percentage of observations below the upper limit of each class interval in a cumulative frequency distribution is known as a(n):
(Multiple Choice)
4.9/5 (40)
A professor needs to select a volunteer for a project.Which of the following would not be an example of a simple random sample?
(Multiple Choice)
4.9/5 (33)
Of those in the sample who did well in the final exam,what percentage of them spent the weekend before the exam studying?
(Essay)
4.7/5 (38)
Ordinal data indicate the rank ordering of items,and similar to nominal data,the values are words that describe responses.
(True/False)
4.8/5 (32)
A baseball player is assigned the number 15 and another one the number 25.This is an example of ________ data.
(Multiple Choice)
4.8/5 (31)
THE NEXT QUESTIONS ARE BASED ON THE FOLLOWING INFORMATION:
At New York State University,800 students are randomly selected and asked the distance of their commute to campus.From this group a mean of 14.6 miles is computed.
-What is the sample?
(Essay)
4.8/5 (35)
By selecting a particular scale of measurement,the researcher can,in a time-series plot,create an impression either of relative stability or of substantial fluctuation over time.
(True/False)
4.8/5 (37)
The role of inferential statistics is to help understand the characteristics of the sample.
(True/False)
4.9/5 (42)
As a businessperson,in what ways may you find yourself involved with statistics?
(Essay)
4.8/5 (39)
Bar charts and pie charts are commonly used to describe categorical data.
(True/False)
4.8/5 (35)
Consider the following frequency distributions generated by Excel.What is the missing cumulative % value identified by the asterisk? 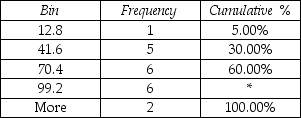
(Multiple Choice)
4.8/5 (32)
A parameter is a descriptive measure computed from an entire population.
(True/False)
4.7/5 (42)
A consumer goods company has been studying the effect of advertising on total profits.As part of this study,data on advertising expenditures ($1000s)and total sales ($1000s)were collected for a five-month period and are as follows: (15,150),(22.5,300),(10.5,120),(18,180),and (21,225),where the first number is advertising expenditures and the second is total sales.Graphically display the data,and state an appropriate conclusion from the graph.
(Essay)
4.8/5 (44)
Procedures used to describe data in simple arithmetic terms with easy-to-draw pencil-and-paper pictures are called:
(Multiple Choice)
4.7/5 (32)
Filters
- Essay(0)
- Multiple Choice(0)
- Short Answer(0)
- True False(0)
- Matching(0)