Exam 1: Describing Data: Graphical
Exam 1: Describing Data: Graphical247 Questions
Exam 2: Describing Data: Numerical326 Questions
Exam 3: Probability345 Questions
Exam 4: Discrete Random Variables and Probability Distributions257 Questions
Exam 5: Continuous Random Variables and Probability Distributions239 Questions
Exam 6: Sampling and Sampling Distributions147 Questions
Exam 7: Estimation: Single Population151 Questions
Exam 8: Estimation: Additional Topics109 Questions
Exam 9: Hypothesis Testing: Single Population164 Questions
Exam 10: Hypothesis Testing: Additional Topics103 Questions
Exam 11: Simple Regression217 Questions
Exam 12: Multiple Regression252 Questions
Exam 13: Additional Topics in Regression Analysis168 Questions
Exam 14: Analysis of Categorical Data241 Questions
Exam 15: Analysis of Variance192 Questions
Exam 16: Time-Series Analysis and Forecasting138 Questions
Exam 17: Additional Topics in Sampling110 Questions
Select questions type
Suppose a sample size of 50 is desired and the population consists of 2,500 names in alphabetical order.The jth,or systematic sampling number would be:
(Multiple Choice)
4.8/5  (35)
(35)
Consider the terms: information,data,and knowledge.From a statistical standpoint,list these terms in order of increasing usefulness in making decisions.
(Multiple Choice)
4.8/5 (39)
Which analytical tool is often used to separate the "vital few" from the "trivial many"?
(Multiple Choice)
4.8/5 (37)
Ratio data indicate both rank and distance from a natural zero,with ratios of two measures having meaning.
(True/False)
4.7/5 (34)
Statistics provides business functional areas with tools to make decisions under conditions of uncertainty.
(True/False)
4.8/5 (49)
Companies are often interested in knowing how customers learned about their products.They often solicit this information on mail-in warranty cards.The customers' responses for a particular product were gathered and the data are presented in the pie chart below. 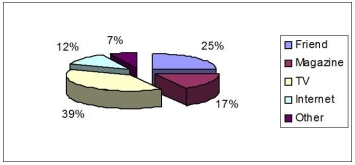 What percentage of respondents learned about the product through television or the Internet?
(Multiple Choice)
4.9/5 (33)
THE NEXT QUESTIONS ARE BASED ON THE FOLLOWING INFORMATION:
The data presented below were collected on the amount of time,in hours;it takes an employee,to process an order at a local plumbing wholesaler.
 -Construct a frequency distribution of the data.
(Essay)
4.8/5 (39)
THE NEXT QUESTIONS ARE BASED ON THE FOLLOWING INFORMATION:
In a recent marketing experiment,consumers were given one of four different types of dishwashing detergent and asked to use it for a month.At the end of that time they were asked to rate the detergent in terms of overall quality.The results are presented below.
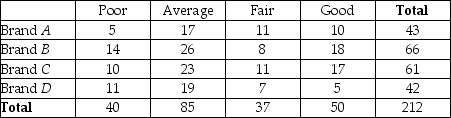 -What percentage of the consumers rated their detergent below average?
(Multiple Choice)
4.8/5 (34)
The 2005 mobile phone manufacturers' global market shares were as follows: Nokia 26.9%,Motorola 16.9%,Ericson 10.5%,Samsung 6.2%,Panasonic 5.5%,others (Siemens,Alcatel,Mitsubishi,Philips,NEC,and more)34.0%.Present this information in a pie chart.
(Essay)
4.9/5 (36)
THE NEXT QUESTIONS ARE BASED ON THE FOLLOWING INFORMATION:
Suppose you own a DVD rental store.
-Give an example of a question where testing a hypothesis about a parameter would be helpful.
(Essay)
4.9/5 (44)
Numerical variables can be subdivided into two types.What are they?
(Multiple Choice)
4.8/5 (34)
The statement "The price of a Canon digital camera is likely to be lower in three months than it is now" is arrived at by the use of descriptive statistics.
(True/False)
4.7/5 (36)
THE NEXT QUESTIONS ARE BASED ON THE FOLLOWING INFORMATION:
Suppose you own a DVD rental store.
-Give an example of a forecasting question.
(Essay)
4.9/5 (27)
As part of the graduation paperwork,seniors at a particular college were asked to indicate their post-graduation plans.Results showed that 15% planned to start graduate school right after college graduation.Is this an example of descriptive or inferential statistics?
(Essay)
4.8/5 (39)
A department of mathematical sciences has majors in four areas.
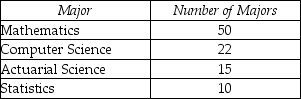 If a pie chart is constructed for these data,what would be the percentage of the graph for each major?
(Essay)
4.9/5 (42)
A histogram is the best graphical tool to display qualitative data.
(True/False)
4.8/5 (36)
Of those in the sample who went partying the weekend before the final exam,what percentage of them did poorly in the exam?
(Essay)
4.9/5 (36)
Cross tables can be used for summarizing both qualitative and quantitative data.
(True/False)
4.9/5 (34)
Filters
- Essay(0)
- Multiple Choice(0)
- Short Answer(0)
- True False(0)
- Matching(0)