Exam 3: Where Prices Come From: The Interaction of Supply and Demand
Exam 1: Economics: Foundations and Models148 Questions
Exam 2: Trade-Offs, Comparative Advantage, and the Market System314 Questions
Exam 3: Where Prices Come From: The Interaction of Supply and Demand314 Questions
Exam 4: GDP: Measuring Total Production and Income277 Questions
Exam 5: Unemployment and Inflation300 Questions
Exam 6: Economic Growth, The Financial System, and Business Cycles262 Questions
Exam 7: Long-Run Economic Growth: Sources and Policies280 Questions
Exam 8: Aggregate Expenditure and Output in the Short Run315 Questions
Exam 9: Aggregate Demand and Aggregate Supply Analysis246 Questions
Exam 10: Money, Banks, and the Bank of Canada285 Questions
Exam 11: Monetary Policy281 Questions
Exam 12: Fiscal Policy303 Questions
Exam 13: Inflation, Unemployment, and Bank of Canada Policy265 Questions
Exam 14: Macroeconomics in an Open Economy280 Questions
Exam 15: The International Financial System228 Questions
Select questions type
As incomes in Alberta fall people are drinking less craft beer and more beer produced by international brewers. Thus, an economist would consider beer produced by international brewers to be a(n)
(Multiple Choice)
4.9/5  (37)
(37)
Which of the following would cause the equilibrium price of ketchup to increase and the equilibrium quantity of ketchup to decrease?
(Multiple Choice)
4.8/5 (38)
If the price of peaches (a substitute for plums)increases, the demand for plums will decrease.
(True/False)
5.0/5 (51)
A normal good is a good for which the demanded increases as income decreases, holding everything else constant.
(True/False)
4.8/5 (40)
Figure 3.12 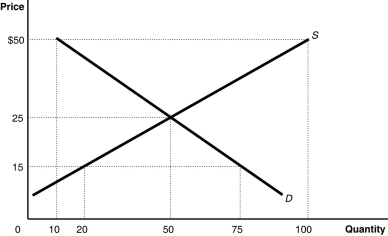 Alt text for Figure 3.12: In figure 3.23, a graph plotting intersecting supply and demand curves represents the market for coffee grinders.
Long description for Figure 3.12: The x-axis is labelled, Quantity, with the values 0, 10, 20, 50, 75, and 100 marked.The y-axis is labelled, Price, with the values 0, 15, 25, and 50 dollars marked.Curve D is a straight line which slopes down from the top left corner to the bottom right corner.Curve S is a straight line which begins in the bottom left corner and slopes up to the top right corner.The equilibrium of the 2 curves is (50,25).The point plotted on curve S to the left of equilibrium is (20,15).The point plotted on curve D to the right of point of equilibrium is (75,15).The point plotted to the right of equilibrium on curve S is (100,50).The point plotted to the right of the equilibrium on curve D is (10,50).
-Refer to Figure 3.12.The figure above represents the market for coffee grinders.Assume that the market price is $21.Which of the following statements is true?
Alt text for Figure 3.12: In figure 3.23, a graph plotting intersecting supply and demand curves represents the market for coffee grinders.
Long description for Figure 3.12: The x-axis is labelled, Quantity, with the values 0, 10, 20, 50, 75, and 100 marked.The y-axis is labelled, Price, with the values 0, 15, 25, and 50 dollars marked.Curve D is a straight line which slopes down from the top left corner to the bottom right corner.Curve S is a straight line which begins in the bottom left corner and slopes up to the top right corner.The equilibrium of the 2 curves is (50,25).The point plotted on curve S to the left of equilibrium is (20,15).The point plotted on curve D to the right of point of equilibrium is (75,15).The point plotted to the right of equilibrium on curve S is (100,50).The point plotted to the right of the equilibrium on curve D is (10,50).
-Refer to Figure 3.12.The figure above represents the market for coffee grinders.Assume that the market price is $21.Which of the following statements is true?
(Multiple Choice)
4.9/5 (33)
The following equations represent the demand and supply for bird feeders. QD = 35 - P
QS = -5 + 3P
What is the equilibrium price (P)and quantity (Q - in thousands)of bird feeders?
(Multiple Choice)
4.8/5 (46)
Cole was discussing the market for cocoa beans with his friend John Schmidt.Cole said, "Ever since Venezuela announced that its cocoa harvest was its lowest ever in fifteen years, the price of cocoa beans has been rising and rising and people are buying more and more.I think the demand for cocoa beans must be upward sloping." Is Cole right? Briefly explain why or why not.
(Essay)
5.0/5 (29)
Assume there is a shortage in the market for smart phones.Which of the following statements correctly describes this situation?
(Multiple Choice)
4.8/5 (41)
All else equal, a ________ of orange juice used in breakfast drinks would shift the ________ curve for breakfast drinks to the left.
(Multiple Choice)
4.8/5 (41)
The income effect of a price change refers to the change in the quantity demanded of a good that results from a change in the price of a substitute product.
(True/False)
5.0/5 (34)
What is the difference between an "increase in supply" and an "increase in quantity supplied"?
(Multiple Choice)
4.9/5 (39)
Which of the following is evidence of a surplus of bananas?
(Multiple Choice)
4.9/5 (36)
Scarcity is defined as the situation that exists when the quantity demanded for a good is greater than the quantity supplied.
(True/False)
4.9/5 (36)
According to the Australian Wool Innovation, severe drought conditions in Australia contributed to the lowest level of wool production in 50 years.This record low production has driven up prices sharply in Australian wool markets.Meanwhile, the price of raw cotton increased significantly for the first time in many years.
a.Illustrate these observations with one demand and supply graph for the market for Australian wool and another demand and supply graph for raw cotton.
b.Make sure that your graphs clearly show (1)the initial equilibrium before the decrease in the supply of Australian wool and (2)the final equilibrium.
c.Use arrows to indicate any shifts in the demand and supply curves for each market.
d.Label your graphs fully and write an explanation of your work.
(Essay)
5.0/5 (48)
Suppose that when the price of ice cream increases, Liza buys less hot fudge.To Liza,
(Multiple Choice)
4.7/5 (37)
If pilots and flight attendants agree to wage and benefit reductions in the wake of financial difficulties in the airline industry, what impact would this have on the supply and demand in the market for airline service, assuming no other changes take place in this market?
(Essay)
4.7/5 (36)
If the population increases and input prices increase, the equilibrium price of a product will definitely increase.
(True/False)
4.9/5 (37)
Table 3.1  -Refer to Table 3.1.The table above shows the demand schedules for loose-leaf tea of two individuals (Sunil and Mia )and the rest of the market.At a price of $5, the quantity demanded in the market would be
(Multiple Choice)
4.8/5 (44)
Filters
- Essay(0)
- Multiple Choice(0)
- Short Answer(0)
- True False(0)
- Matching(0)