Exam 3: Where Prices Come From: The Interaction of Supply and Demand
Exam 1: Economics: Foundations and Models148 Questions
Exam 2: Trade-Offs, Comparative Advantage, and the Market System314 Questions
Exam 3: Where Prices Come From: The Interaction of Supply and Demand314 Questions
Exam 4: GDP: Measuring Total Production and Income277 Questions
Exam 5: Unemployment and Inflation300 Questions
Exam 6: Economic Growth, The Financial System, and Business Cycles262 Questions
Exam 7: Long-Run Economic Growth: Sources and Policies280 Questions
Exam 8: Aggregate Expenditure and Output in the Short Run315 Questions
Exam 9: Aggregate Demand and Aggregate Supply Analysis246 Questions
Exam 10: Money, Banks, and the Bank of Canada285 Questions
Exam 11: Monetary Policy281 Questions
Exam 12: Fiscal Policy303 Questions
Exam 13: Inflation, Unemployment, and Bank of Canada Policy265 Questions
Exam 14: Macroeconomics in an Open Economy280 Questions
Exam 15: The International Financial System228 Questions
Select questions type
Suppose that when the price of hamburgers increases, the Ruiz family buys more hot dogs.To the Ruiz family,
(Multiple Choice)
4.8/5  (35)
(35)
During the recovery from the recession of 2008-2009, sales of low-cost beer fell and demand for microbrewed beer rose.This means
(Multiple Choice)
4.9/5 (36)
Figure 3.12 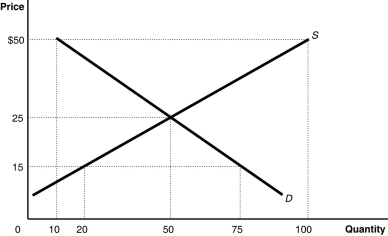 Alt text for Figure 3.12: In figure 3.23, a graph plotting intersecting supply and demand curves represents the market for coffee grinders.
Long description for Figure 3.12: The x-axis is labelled, Quantity, with the values 0, 10, 20, 50, 75, and 100 marked.The y-axis is labelled, Price, with the values 0, 15, 25, and 50 dollars marked.Curve D is a straight line which slopes down from the top left corner to the bottom right corner.Curve S is a straight line which begins in the bottom left corner and slopes up to the top right corner.The equilibrium of the 2 curves is (50,25).The point plotted on curve S to the left of equilibrium is (20,15).The point plotted on curve D to the right of point of equilibrium is (75,15).The point plotted to the right of equilibrium on curve S is (100,50).The point plotted to the right of the equilibrium on curve D is (10,50).
-Refer to Figure 3.12.The figure above represents the market for coffee grinders.Compare the conditions in the market when the price is $15 and when the price is $21.Which of the following describes how the market differs at these prices?
Alt text for Figure 3.12: In figure 3.23, a graph plotting intersecting supply and demand curves represents the market for coffee grinders.
Long description for Figure 3.12: The x-axis is labelled, Quantity, with the values 0, 10, 20, 50, 75, and 100 marked.The y-axis is labelled, Price, with the values 0, 15, 25, and 50 dollars marked.Curve D is a straight line which slopes down from the top left corner to the bottom right corner.Curve S is a straight line which begins in the bottom left corner and slopes up to the top right corner.The equilibrium of the 2 curves is (50,25).The point plotted on curve S to the left of equilibrium is (20,15).The point plotted on curve D to the right of point of equilibrium is (75,15).The point plotted to the right of equilibrium on curve S is (100,50).The point plotted to the right of the equilibrium on curve D is (10,50).
-Refer to Figure 3.12.The figure above represents the market for coffee grinders.Compare the conditions in the market when the price is $15 and when the price is $21.Which of the following describes how the market differs at these prices?
(Multiple Choice)
4.8/5 (38)
An article in the Wall Street Journal in early 2001 noted two developments in the market for laser eye surgery.The first development concerned side effects from the surgery, including blurred vision.The second development was that the companies renting eye-surgery machinery to doctors had reduced their charges.In the market for laser eye surgeries, these two developments
(Multiple Choice)
4.8/5 (45)
Hurricane Arthur interrupted shipments of crude oil to refineries in eastern Canada.In the market for gasoline,
(Multiple Choice)
4.7/5 (39)
Figure 3.2 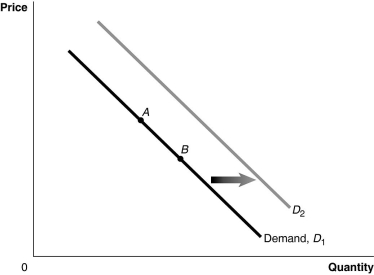 Alt text for Figure 3.2: In figure 3.2, a graph of the effect of an increase in the price of a complement on demand curve.
Long description for Figure 3.2: The x-axis is labelled, Quantity, and y-axis is labelled, Price.Curve Demand, D1, is a straight line which slopes down from the top left corner to the bottom right corner.Curve D2 follows the same slope as curve D1, but is plotted to the right.2 points, A and B, are plotted in the middle of curve D1.A right pointing arrow indicates the change from curve D1 to curve D2.
-Refer to Figure 3.2.If the product represented is a normal good, an increase in income would be represented by a movement from
Alt text for Figure 3.2: In figure 3.2, a graph of the effect of an increase in the price of a complement on demand curve.
Long description for Figure 3.2: The x-axis is labelled, Quantity, and y-axis is labelled, Price.Curve Demand, D1, is a straight line which slopes down from the top left corner to the bottom right corner.Curve D2 follows the same slope as curve D1, but is plotted to the right.2 points, A and B, are plotted in the middle of curve D1.A right pointing arrow indicates the change from curve D1 to curve D2.
-Refer to Figure 3.2.If the product represented is a normal good, an increase in income would be represented by a movement from
(Multiple Choice)
4.9/5 (36)
As the number of firms in a market decreases, the supply curve will shift to the left and the equilibrium price will rise.
(True/False)
4.7/5 (43)
Currently, China buys more than 40% of the Canadian canola crop. In the summer of 2016 the Chinese government was planning to implement policies that would severely limit the ability of Canadian farmers to sell canola to China.If China were to stop buying Canadian canola what would happen in the market for Canadian canola?
(Essay)
4.9/5 (38)
When all else equal, as the price of a product falls, the quantity supplied decreases.
(True/False)
4.8/5 (27)
Would a change in the price of inline skates cause a change in the supply of inline skates? Why or why not?
(Essay)
4.9/5 (35)
Which of the following is the correct way to describe equilibrium in a market?
(Multiple Choice)
4.9/5 (43)
The law of demand implies, holding everything else constant, that as the price of yogurt
(Multiple Choice)
4.8/5 (36)
The income effect of a price change refers to the impact of a change in
(Multiple Choice)
4.8/5 (31)
If the demand curve for a product shifts to the left and the supply curve for the product shifts to the left, the equilibrium quantity will decrease.
(True/False)
5.0/5 (45)
Figure 3.14 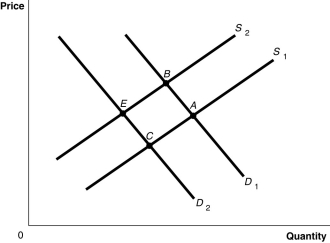 Alt text for Figure 3.14: In figure 3.14, a graph plotting intersecting demand and supply curves represents the change in equilibrium point in the apple market with the decrease in the price of a substitute fruit, orange and the increase in the wages of apple workers.
Long description for Figure 3.14: The x-axis is labelled, Quantity and the y-axis is labelled, Price.Curve D1 is a straight line which slopes down from the top left corner to the bottom right corner.Curve D2 is parallel with curve D1, but is plotted to the left.Curve S1 is a straight line which slopes up from the bottom right corner to the top left corner.Curve S2 is parallel to curve S1, but is plotted to the left.The 4 curves intersect at 4 points; A, B, on the right side of the lines, and C and D, on the left sides of the lines.
-Refer to Figure 3.14.The graph in this figure illustrates an initial competitive equilibrium in the market for apples at the intersection of D1 and S1 (point
Alt text for Figure 3.14: In figure 3.14, a graph plotting intersecting demand and supply curves represents the change in equilibrium point in the apple market with the decrease in the price of a substitute fruit, orange and the increase in the wages of apple workers.
Long description for Figure 3.14: The x-axis is labelled, Quantity and the y-axis is labelled, Price.Curve D1 is a straight line which slopes down from the top left corner to the bottom right corner.Curve D2 is parallel with curve D1, but is plotted to the left.Curve S1 is a straight line which slopes up from the bottom right corner to the top left corner.Curve S2 is parallel to curve S1, but is plotted to the left.The 4 curves intersect at 4 points; A, B, on the right side of the lines, and C and D, on the left sides of the lines.
-Refer to Figure 3.14.The graph in this figure illustrates an initial competitive equilibrium in the market for apples at the intersection of D1 and S1 (point
(Multiple Choice)
4.8/5 (46)
In each of the following situations, list what will happen to the equilibrium price and the equilibrium quantity for a particular product, which is a normal good.
a.The population increases and the price of inputs increase.
b.The price of a complement increases and technology advances.
c.The number of firms in the market increases and income increases.
d.Price is expected to increase in the future.
e.Consumer preference increases and the price of a substitute in production decreases.
(Essay)
4.8/5 (32)
Figure 3.1  Alt text for Figure 3.1: In figure 3.1, graph of the effect of an increase in population on the demand curve.
Long description for Figure 3.1: The x-axis is labelled, Quantity, and y-axis is labelled, Price.Curve Demand, D1, is a straight line which slopes down from the top left corner to the bottom right corner.Curve D2 follows the same slope as curve D1, but is plotted to the right.2 points, A and B, are plotted in the middle of curve D1.A right pointing arrow indicates the change from curve D1 to curve D2.
-Refer to Figure 3.1.A decrease in the price of the product would be represented by a movement from
Alt text for Figure 3.1: In figure 3.1, graph of the effect of an increase in population on the demand curve.
Long description for Figure 3.1: The x-axis is labelled, Quantity, and y-axis is labelled, Price.Curve Demand, D1, is a straight line which slopes down from the top left corner to the bottom right corner.Curve D2 follows the same slope as curve D1, but is plotted to the right.2 points, A and B, are plotted in the middle of curve D1.A right pointing arrow indicates the change from curve D1 to curve D2.
-Refer to Figure 3.1.A decrease in the price of the product would be represented by a movement from
(Multiple Choice)
4.9/5 (32)
Studies have shown that drinking one glass of red wine per day may help prevent heart disease.Assume this is true.Suppose that a fungal disease destroys a large portion of the grape harvest of B.C.vineyards.In the market for red wine, these two developments would
(Multiple Choice)
4.7/5 (45)
Filters
- Essay(0)
- Multiple Choice(0)
- Short Answer(0)
- True False(0)
- Matching(0)