Exam 3: Where Prices Come From: The Interaction of Supply and Demand
Exam 1: Economics: Foundations and Models148 Questions
Exam 2: Trade-Offs, Comparative Advantage, and the Market System314 Questions
Exam 3: Where Prices Come From: The Interaction of Supply and Demand314 Questions
Exam 4: GDP: Measuring Total Production and Income277 Questions
Exam 5: Unemployment and Inflation300 Questions
Exam 6: Economic Growth, The Financial System, and Business Cycles262 Questions
Exam 7: Long-Run Economic Growth: Sources and Policies280 Questions
Exam 8: Aggregate Expenditure and Output in the Short Run315 Questions
Exam 9: Aggregate Demand and Aggregate Supply Analysis246 Questions
Exam 10: Money, Banks, and the Bank of Canada285 Questions
Exam 11: Monetary Policy281 Questions
Exam 12: Fiscal Policy303 Questions
Exam 13: Inflation, Unemployment, and Bank of Canada Policy265 Questions
Exam 14: Macroeconomics in an Open Economy280 Questions
Exam 15: The International Financial System228 Questions
Select questions type
Figure 3.2 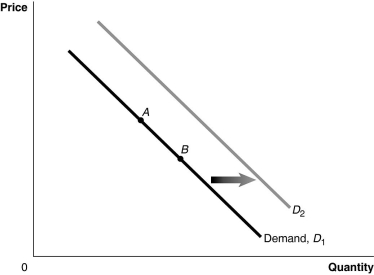 Alt text for Figure 3.2: In figure 3.2, a graph of the effect of an increase in the price of a complement on demand curve.
Long description for Figure 3.2: The x-axis is labelled, Quantity, and y-axis is labelled, Price.Curve Demand, D1, is a straight line which slopes down from the top left corner to the bottom right corner.Curve D2 follows the same slope as curve D1, but is plotted to the right.2 points, A and B, are plotted in the middle of curve D1.A right pointing arrow indicates the change from curve D1 to curve D2.
-Refer to Figure 3.2.A decrease in the expected future price of the product would be represented by a movement from
Alt text for Figure 3.2: In figure 3.2, a graph of the effect of an increase in the price of a complement on demand curve.
Long description for Figure 3.2: The x-axis is labelled, Quantity, and y-axis is labelled, Price.Curve Demand, D1, is a straight line which slopes down from the top left corner to the bottom right corner.Curve D2 follows the same slope as curve D1, but is plotted to the right.2 points, A and B, are plotted in the middle of curve D1.A right pointing arrow indicates the change from curve D1 to curve D2.
-Refer to Figure 3.2.A decrease in the expected future price of the product would be represented by a movement from
(Multiple Choice)
4.8/5  (37)
(37)
Indicate whether each of the following situations would shift the supply curve to the left, to the right, or not at all.
a.An increase in the number of firms in the market
b.An increase in the current price of the product
c.A decrease in productivity
d.An increase in the expected future price of a product
e.A decrease in the price of an input
(Essay)
4.8/5 (30)
Which of the following would cause both the equilibrium price and equilibrium quantity of cotton (assume that cotton is a normal good )to increase?
(Multiple Choice)
4.7/5 (36)
Which of the following will shift the demand curve for a good?
(Multiple Choice)
4.8/5 (39)
Suppose that when the price of raspberries increases, Lonnie increases his purchases of papayas.To Lonnie,
(Multiple Choice)
4.7/5 (30)
The income effect explains why there is an inverse relationship between the price of a product and the quantity of the product demanded.
(True/False)
4.8/5 (37)
What are the two effects that explain the Law of Demand? Briefly explain each effect.
(Essay)
4.9/5 (42)
If Red Bull and Beaver Buzz Energy are considered substitutes, then, other things equal, an increase in the price of the Red Bull will
(Multiple Choice)
4.8/5 (39)
Holding everything else constant, an increase in the price of MP3 players will result in
(Multiple Choice)
4.8/5 (36)
Table 3.5  -Refer to Table 3.5.The equations above describe the demand and supply for Aunt Maud's Premium Hand Lotion.The equilibrium price and quantity for Aunt Maud's lotion are $20 and 30 thousand units.What is the value of economic surplus in this market?
(Multiple Choice)
4.9/5 (38)
Tom Searchinger, a senior attorney at the Environmental Defense Fund, observed that generous U.S.farm subsidies have encouraged farmers to produce more corn and more wheat.How does this affect the market for fertilizer?
(Multiple Choice)
4.8/5 (32)
Electric car enthusiasts want to buy more electric cars at a lower price.All of the following events would have this effect except
(Multiple Choice)
4.9/5 (46)
Market equilibrium occurs where the quantity supplied is equal to the quantity demanded.
(True/False)
4.7/5 (41)
Factory incentives on cell phones have encouraged consumers to upgrade their phones.How does this affect the market for bluetooth headsets?
(Multiple Choice)
4.9/5 (40)
Figure 3.4 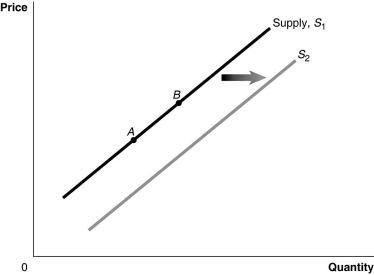 Alt text for Figure 3.4: In figure 3.4, a graph of the effect of technological advancement on supply curve.
Long description for Figure 3.4: The x-axis is labelled, Quantity, and the y-axis is labelled, Price.Curve Supply, S1, is a straight line which slopes up from the bottom left corner to the top right corner.2 points, A and B, are marked in the middle of curve S1.Curve S2 follows the same slope as curve S1, but is plotted to the right.A right pointing arrow indicates the change from curve S1 to curve S2.
-Refer to Figure 3.4.An increase in the price of the product would be represented by a movement from
Alt text for Figure 3.4: In figure 3.4, a graph of the effect of technological advancement on supply curve.
Long description for Figure 3.4: The x-axis is labelled, Quantity, and the y-axis is labelled, Price.Curve Supply, S1, is a straight line which slopes up from the bottom left corner to the top right corner.2 points, A and B, are marked in the middle of curve S1.Curve S2 follows the same slope as curve S1, but is plotted to the right.A right pointing arrow indicates the change from curve S1 to curve S2.
-Refer to Figure 3.4.An increase in the price of the product would be represented by a movement from
(Multiple Choice)
4.8/5 (49)
Figure 3.16 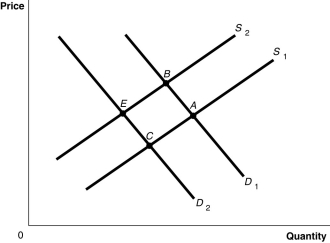 Alt text for Figure 3.16: In figure 3.16, a graph plotting intersecting demand and supply curves represents the change in equilibrium point in the motorcycle market with the increase in price of engines and wages of motorcycle manufacturers.
Long description for Figure 3.16: The x-axis is labelled, Quantity and the y-axis is labelled, Price.Curve D1 is a straight line which slopes down from the top left corner to the bottom right corner.Curve D2 is parallel with curve D1, but is plotted to the left.Curve S1 is a straight line which slopes up from the bottom right corner to the top left corner.Curve S2 is parallel to curve S1, but is plotted to the left.The 4 curves intersect at 4 points; A, B, on the right side of the lines, and C and D, on the left sides of the lines
-Refer to Figure 3.16.The graph in this figure illustrates an initial competitive equilibrium in the market for motorcycles at the intersection of D1 and S1 (point
Alt text for Figure 3.16: In figure 3.16, a graph plotting intersecting demand and supply curves represents the change in equilibrium point in the motorcycle market with the increase in price of engines and wages of motorcycle manufacturers.
Long description for Figure 3.16: The x-axis is labelled, Quantity and the y-axis is labelled, Price.Curve D1 is a straight line which slopes down from the top left corner to the bottom right corner.Curve D2 is parallel with curve D1, but is plotted to the left.Curve S1 is a straight line which slopes up from the bottom right corner to the top left corner.Curve S2 is parallel to curve S1, but is plotted to the left.The 4 curves intersect at 4 points; A, B, on the right side of the lines, and C and D, on the left sides of the lines
-Refer to Figure 3.16.The graph in this figure illustrates an initial competitive equilibrium in the market for motorcycles at the intersection of D1 and S1 (point
(Multiple Choice)
4.8/5 (40)
Explain how it would be possible for the equilibrium price and equilibrium quantity to both increase in the market for motorcycles if consumer preference for motorcycles increases and the number of motorcycle manufacturers decreases.
(Essay)
4.8/5 (37)
Figure 3.3  Alt text for Figure 3.3: In figure 3.3, a graph of the effect of an increase in the price of inputs on the supply curve.
Long description for Figure 3.3: The x-axis is labelled, Quantity, and the y-axis is labelled, Price.Curve Supply, S1, is a straight line which slopes up from the bottom left corner to the top right corner.2 points, A and B, are marked in the middle of curve S1.Curve S2 follows the same slope as curve S1, but is plotted to the right.A right pointing arrow indicates the change from curve S1 to curve S2.
-Refer to Figure 3.3.An increase in the price of substitutes in production would be represented by a movement from
Alt text for Figure 3.3: In figure 3.3, a graph of the effect of an increase in the price of inputs on the supply curve.
Long description for Figure 3.3: The x-axis is labelled, Quantity, and the y-axis is labelled, Price.Curve Supply, S1, is a straight line which slopes up from the bottom left corner to the top right corner.2 points, A and B, are marked in the middle of curve S1.Curve S2 follows the same slope as curve S1, but is plotted to the right.A right pointing arrow indicates the change from curve S1 to curve S2.
-Refer to Figure 3.3.An increase in the price of substitutes in production would be represented by a movement from
(Multiple Choice)
4.9/5 (27)
A firm has an incentive to decrease supply now and increase supply in the future if it expects that
(Multiple Choice)
4.7/5 (26)
Filters
- Essay(0)
- Multiple Choice(0)
- Short Answer(0)
- True False(0)
- Matching(0)