Exam 3: Where Prices Come From: The Interaction of Supply and Demand
Exam 1: Economics: Foundations and Models148 Questions
Exam 2: Trade-Offs, Comparative Advantage, and the Market System314 Questions
Exam 3: Where Prices Come From: The Interaction of Supply and Demand314 Questions
Exam 4: GDP: Measuring Total Production and Income277 Questions
Exam 5: Unemployment and Inflation300 Questions
Exam 6: Economic Growth, The Financial System, and Business Cycles262 Questions
Exam 7: Long-Run Economic Growth: Sources and Policies280 Questions
Exam 8: Aggregate Expenditure and Output in the Short Run315 Questions
Exam 9: Aggregate Demand and Aggregate Supply Analysis246 Questions
Exam 10: Money, Banks, and the Bank of Canada285 Questions
Exam 11: Monetary Policy281 Questions
Exam 12: Fiscal Policy303 Questions
Exam 13: Inflation, Unemployment, and Bank of Canada Policy265 Questions
Exam 14: Macroeconomics in an Open Economy280 Questions
Exam 15: The International Financial System228 Questions
Select questions type
In a perfectly competitive market, there are ________ buyers and ________ sellers.
(Multiple Choice)
4.9/5  (35)
(35)
The demand for medical services in Canada is expected to increase in upcoming years because
(Multiple Choice)
4.9/5 (30)
If consumers believe the price of hybrid vehicles will decrease in the future, this will cause the demand for hybrid vehicles to decrease now.
(True/False)
4.7/5 (33)
In January, buyers of gold expect that the price of gold will fall in February.What will happen in the gold market in January, holding everything else constant?
(Multiple Choice)
4.9/5 (37)
Positive technological change in the production of LCD televisions caused the price of LCD televisions to fall.Holding everything else constant, how would this affect the market for Blu-ray players (a complement to LCD televisions)?
(Multiple Choice)
4.8/5 (36)
Figure 3.8 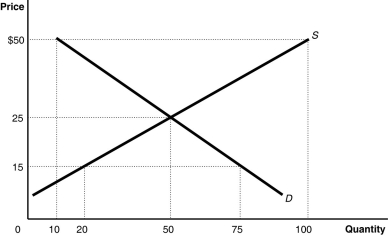 Alt text for Figure 3.8: In figure 3.8, a graph plotting intersecting supply and demand curves represents the market for canvas tote bags.
Long description for Figure 3.8: The x-axis is labelled, Quantity, with the values 0, 10, 20, 50, 75, and 100 marked.The y-axis is labelled, Price, with the values 0, 15, 25, and 50 dollars marked.Curve D is a straight line which slopes down from the top left corner to the bottom right corner.Curve S is a straight line which begins in the bottom left corner and slopes up to the top right corner.The equilibrium of the 2 curves is (50,25).The point plotted on curve S to the left of equilibrium is (20,15).The point plotted on curve D to the right of point of equilibrium is (75,15).The point plotted to the right of equilibrium on curve S is (100,50).The point plotted to the right of the equilibrium on curve D is (10,50).
-Refer to Figure 3.8.The figure above represents the market for canvas tote bags.Assume that the price of tote bags is $15.At this price,
Alt text for Figure 3.8: In figure 3.8, a graph plotting intersecting supply and demand curves represents the market for canvas tote bags.
Long description for Figure 3.8: The x-axis is labelled, Quantity, with the values 0, 10, 20, 50, 75, and 100 marked.The y-axis is labelled, Price, with the values 0, 15, 25, and 50 dollars marked.Curve D is a straight line which slopes down from the top left corner to the bottom right corner.Curve S is a straight line which begins in the bottom left corner and slopes up to the top right corner.The equilibrium of the 2 curves is (50,25).The point plotted on curve S to the left of equilibrium is (20,15).The point plotted on curve D to the right of point of equilibrium is (75,15).The point plotted to the right of equilibrium on curve S is (100,50).The point plotted to the right of the equilibrium on curve D is (10,50).
-Refer to Figure 3.8.The figure above represents the market for canvas tote bags.Assume that the price of tote bags is $15.At this price,
(Multiple Choice)
4.8/5 (40)
Which of the following would cause an increase in the equilibrium price and a decrease in the equilibrium quantity of watermelon?
(Multiple Choice)
4.9/5 (40)
State whether each of the following pairs of products are complements, substitutes, or unrelated.
a.swim fins and scuba tanks
b.Coca-Cola and Volkswagens
c.printers and ink cartridges
d.ice and ice chests
e.Heineken and Corona
(Essay)
4.8/5 (35)
Which of the following will not shift the demand curve for a good?
(Multiple Choice)
4.9/5 (41)
Figure 3.6 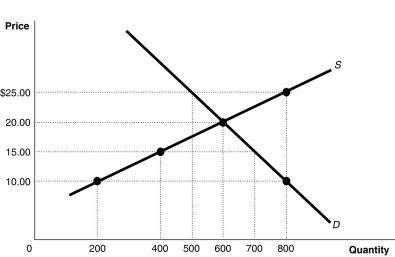 Alt text for Figure 3.6: In figure 3.6, a graph of intersecting supply and demand curves illustrates shortage and surplus in a market, along with its equilibrium.
Long description for Figure 3.6: The x-axis is labelled, Quantity, with the values 0, 200, 400, 500, 600, 700 and 800 marked.The y-axis is labelled, Price, with the values 0, 10.00, 15.00, 20.00 and 25.00 dollars marked.Curve Supply S is a straight line which slopes up from the bottom left corner to the top right corner.4 points are plotted along the curve; (200, 10), (400, 15), (600, 20), and (800, 25).Demand curve D is a straight line which slopes down from the top left corner to the bottom right corner.Curve D intersects the S curve at (600, 20), and passes through another point, (800, 10).All plotted points are connected to the corresponding values on the x and y-axis with dotted lines.
-Refer to Figure 3.6.If the price is $10,
Alt text for Figure 3.6: In figure 3.6, a graph of intersecting supply and demand curves illustrates shortage and surplus in a market, along with its equilibrium.
Long description for Figure 3.6: The x-axis is labelled, Quantity, with the values 0, 200, 400, 500, 600, 700 and 800 marked.The y-axis is labelled, Price, with the values 0, 10.00, 15.00, 20.00 and 25.00 dollars marked.Curve Supply S is a straight line which slopes up from the bottom left corner to the top right corner.4 points are plotted along the curve; (200, 10), (400, 15), (600, 20), and (800, 25).Demand curve D is a straight line which slopes down from the top left corner to the bottom right corner.Curve D intersects the S curve at (600, 20), and passes through another point, (800, 10).All plotted points are connected to the corresponding values on the x and y-axis with dotted lines.
-Refer to Figure 3.6.If the price is $10,
(Multiple Choice)
5.0/5 (38)
Chips and salsa are complements.If the price of salsa decreases, the demand for chips will increase.
(True/False)
4.9/5 (39)
Tuition rises almost every year, yet universities seem to have more and more students every year. What would explain this?
(Multiple Choice)
4.8/5 (33)
Figure 3.6 Alt text for Figure 3.6: In figure 3.6, a graph of intersecting supply and demand curves illustrates shortage and surplus in a market, along with its equilibrium.
Long description for Figure 3.6: The x-axis is labelled, Quantity, with the values 0, 200, 400, 500, 600, 700 and 800 marked.The y-axis is labelled, Price, with the values 0, 10.00, 15.00, 20.00 and 25.00 dollars marked.Curve Supply S is a straight line which slopes up from the bottom left corner to the top right corner.4 points are plotted along the curve; (200, 10), (400, 15), (600, 20), and (800, 25).Demand curve D is a straight line which slopes down from the top left corner to the bottom right corner.Curve D intersects the S curve at (600, 20), and passes through another point, (800, 10).All plotted points are connected to the corresponding values on the x and y-axis with dotted lines.
-Refer to Figure 3.6.At a price of $10, how many units will be sold?
(Multiple Choice)
4.9/5 (40)
Figure 3.7 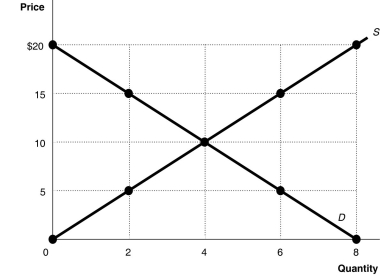 Alt text for Figure 3.7: In figure 3.7, a graph plotting intersecting supply and demand curves illustrates surplus and shortage in a market, along with an equilibrium.
Long description for Figure 3.7: The x-axis is labelled, Quantity, and is marked from 0 to 8 in increments of 2.The y-axis is labelled, Price, and is marked from 0 to 20 dollars in increments of 5.Curve D is a straight line which slopes down from the top left corner to the bottom right corner.Curve S is a straight line which begins in the bottom left corner and slopes up to the top right corner.The equilibrium of the 2 curves is marked at (4,10).2 points plotted on the demand curve to the left of the equilibrium are (0,20)and (2,15).2 points plotted on the demand curve to the right of the equilibrium are (6,5)and (8,0).2 points plotted on the supply curve to the right of the equilibrium are (6,15)and (8,20).2 points plotted on the supply curve to the left of the equilibrium are (2,5)and (0,0).
-Refer to Figure 3.7.At a price of $5, the quantity sold
Alt text for Figure 3.7: In figure 3.7, a graph plotting intersecting supply and demand curves illustrates surplus and shortage in a market, along with an equilibrium.
Long description for Figure 3.7: The x-axis is labelled, Quantity, and is marked from 0 to 8 in increments of 2.The y-axis is labelled, Price, and is marked from 0 to 20 dollars in increments of 5.Curve D is a straight line which slopes down from the top left corner to the bottom right corner.Curve S is a straight line which begins in the bottom left corner and slopes up to the top right corner.The equilibrium of the 2 curves is marked at (4,10).2 points plotted on the demand curve to the left of the equilibrium are (0,20)and (2,15).2 points plotted on the demand curve to the right of the equilibrium are (6,5)and (8,0).2 points plotted on the supply curve to the right of the equilibrium are (6,15)and (8,20).2 points plotted on the supply curve to the left of the equilibrium are (2,5)and (0,0).
-Refer to Figure 3.7.At a price of $5, the quantity sold
(Multiple Choice)
4.8/5 (35)
What would happen in the market for laser eye surgery if provincial health plans started to cover a portion of the price of voluntary procedures?
(Multiple Choice)
4.8/5 (46)
A decrease in the price of inputs will cause the supply curve for a product to shift to the right.
(True/False)
4.8/5 (44)
In July, market analysts predict that the price of gold will rise in August.What happens in the gold market in July, holding everything else constant?
(Multiple Choice)
4.9/5 (33)
Last month, the Tecumseh Corporation supplied 400 units of three-ring binders at $6 per unit.This month, the company supplied the same quantity of binders at $4 per unit.Based on this evidence, Tecumseh has experienced
(Multiple Choice)
4.9/5 (43)
Filters
- Essay(0)
- Multiple Choice(0)
- Short Answer(0)
- True False(0)
- Matching(0)