Exam 3: Where Prices Come From: The Interaction of Supply and Demand
Exam 1: Economics: Foundations and Models148 Questions
Exam 2: Trade-Offs, Comparative Advantage, and the Market System314 Questions
Exam 3: Where Prices Come From: The Interaction of Supply and Demand314 Questions
Exam 4: GDP: Measuring Total Production and Income277 Questions
Exam 5: Unemployment and Inflation300 Questions
Exam 6: Economic Growth, The Financial System, and Business Cycles262 Questions
Exam 7: Long-Run Economic Growth: Sources and Policies280 Questions
Exam 8: Aggregate Expenditure and Output in the Short Run315 Questions
Exam 9: Aggregate Demand and Aggregate Supply Analysis246 Questions
Exam 10: Money, Banks, and the Bank of Canada285 Questions
Exam 11: Monetary Policy281 Questions
Exam 12: Fiscal Policy303 Questions
Exam 13: Inflation, Unemployment, and Bank of Canada Policy265 Questions
Exam 14: Macroeconomics in an Open Economy280 Questions
Exam 15: The International Financial System228 Questions
Select questions type
Figure 3.7 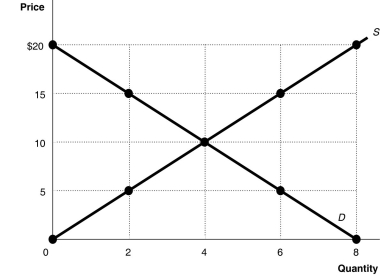 Alt text for Figure 3.7: In figure 3.7, a graph plotting intersecting supply and demand curves illustrates surplus and shortage in a market, along with an equilibrium.
Long description for Figure 3.7: The x-axis is labelled, Quantity, and is marked from 0 to 8 in increments of 2.The y-axis is labelled, Price, and is marked from 0 to 20 dollars in increments of 5.Curve D is a straight line which slopes down from the top left corner to the bottom right corner.Curve S is a straight line which begins in the bottom left corner and slopes up to the top right corner.The equilibrium of the 2 curves is marked at (4,10).2 points plotted on the demand curve to the left of the equilibrium are (0,20)and (2,15).2 points plotted on the demand curve to the right of the equilibrium are (6,5)and (8,0).2 points plotted on the supply curve to the right of the equilibrium are (6,15)and (8,20).2 points plotted on the supply curve to the left of the equilibrium are (2,5)and (0,0).
-Refer to Figure 3.7.At a price of $15,
Alt text for Figure 3.7: In figure 3.7, a graph plotting intersecting supply and demand curves illustrates surplus and shortage in a market, along with an equilibrium.
Long description for Figure 3.7: The x-axis is labelled, Quantity, and is marked from 0 to 8 in increments of 2.The y-axis is labelled, Price, and is marked from 0 to 20 dollars in increments of 5.Curve D is a straight line which slopes down from the top left corner to the bottom right corner.Curve S is a straight line which begins in the bottom left corner and slopes up to the top right corner.The equilibrium of the 2 curves is marked at (4,10).2 points plotted on the demand curve to the left of the equilibrium are (0,20)and (2,15).2 points plotted on the demand curve to the right of the equilibrium are (6,5)and (8,0).2 points plotted on the supply curve to the right of the equilibrium are (6,15)and (8,20).2 points plotted on the supply curve to the left of the equilibrium are (2,5)and (0,0).
-Refer to Figure 3.7.At a price of $15,
(Multiple Choice)
4.9/5  (34)
(34)
How does the increasing use of digital cameras affect the market for traditional camera film?
(Multiple Choice)
4.7/5 (42)
How does the increasing use of MP3 players affect the market for compact discs?
(Multiple Choice)
4.9/5 (29)
Assume that the hourly price for the services of personal trainers has risen and sales of these services have also risen.One can conclude that
(Multiple Choice)
4.7/5 (38)
Nearly a quarter of China's 1.3 billion people are under the age of 15.How will this affect high school enrollment over the next fifteen years? The labour market over the next fifteen years?
(Essay)
4.7/5 (40)
Which of the following would cause a decrease in the supply of milk?
(Multiple Choice)
4.8/5 (34)
Figure 3.15 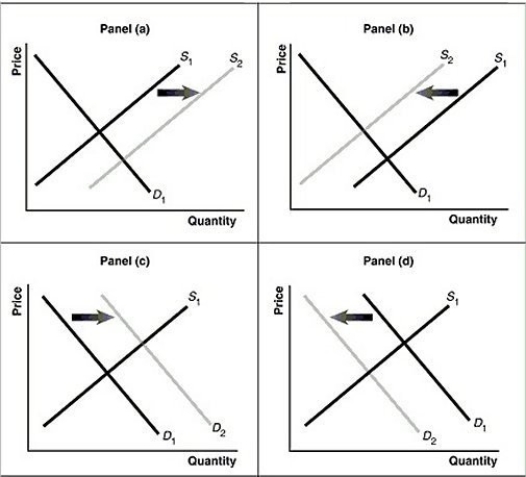 Alt text for Figure 3.15a: In figure 3.15a, a graph of intersecting demand and supply curves represents a rising supply of Blu-ray disc players.
Long description for Figure 3.15a: The x-axis is labelled, Quantity and the y-axis is labelled, as Price.Curve D1 is a straight line which slopes down from the top left corner to the bottom right corner.Curve S1 is a straight line which slopes up from the bottom left to the top right.The point of intersection is at the midpoints of both lines.Curve S2 is a straight line, parallel to curve S1, but plotted to the right.A right pointing arrow indicates the change from S1 to S2.
Alt text for Figure 3.15b: In figure 3.15b, a graph of intersecting demand and supply curves represents a falling supply of Blu-ray players.
Long description for Figure 3.15b: The x-axis is labelled, Quantity and the y-axis is labelled, as Price.Curve D1 is a straight line which slopes down from the top left corner to the bottom right corner.Curve S1 is a straight line which slopes up from the bottom left to the top right.The point of intersection is at the midpoints of both lines.Curve S2 is a straight line, parallel to curve S1, but plotted to the left.A left pointing arrow indicates the change from S1 to S2.
Alt text for Figure 3.15c: In figure 3.15c, a graph of intersecting demand and supply curves represents a rising demand for Blu-ray players.
Long description for Figure 3.15c: The x-axis is labelled, Quantity and the y-axis is labelled, as Price.Curve D1 is a straight line which slopes down from the top left corner to the bottom right corner.Curve S1 is a straight line which slopes up from the bottom left to the top right.The point of intersection is at the midpoints of both lines.Curve D2 is a straight line, parallel to curve D1, but plotted to the right.A right pointing arrow indicates the change from D1 to D2.
Alt text for Figure 3.15d: In figure 3.15d, a graph of intersecting demand and supply curves represents a falling demand for Blu-ray disc players.
Long description for Figure 3.15d: The x-axis is labelled, Quantity and the y-axis is labelled, as Price.Curve D1 is a straight line which slopes down from the top left corner to the bottom right corner.Curve S1 is a straight line which slopes up from the bottom left to the top right.The point of intersection is at the midpoints of both lines.Curve D2 is a straight line, parallel to curve D1, but plotted to the left.A left pointing arrow indicates the change from D1 to D2.
-Refer to Figure 3.15.Assume that the graphs in this figure represent the demand and supply curves for laptop computers.Which panel best describes what happens in this market when the price of computer hard drives falls?
Alt text for Figure 3.15a: In figure 3.15a, a graph of intersecting demand and supply curves represents a rising supply of Blu-ray disc players.
Long description for Figure 3.15a: The x-axis is labelled, Quantity and the y-axis is labelled, as Price.Curve D1 is a straight line which slopes down from the top left corner to the bottom right corner.Curve S1 is a straight line which slopes up from the bottom left to the top right.The point of intersection is at the midpoints of both lines.Curve S2 is a straight line, parallel to curve S1, but plotted to the right.A right pointing arrow indicates the change from S1 to S2.
Alt text for Figure 3.15b: In figure 3.15b, a graph of intersecting demand and supply curves represents a falling supply of Blu-ray players.
Long description for Figure 3.15b: The x-axis is labelled, Quantity and the y-axis is labelled, as Price.Curve D1 is a straight line which slopes down from the top left corner to the bottom right corner.Curve S1 is a straight line which slopes up from the bottom left to the top right.The point of intersection is at the midpoints of both lines.Curve S2 is a straight line, parallel to curve S1, but plotted to the left.A left pointing arrow indicates the change from S1 to S2.
Alt text for Figure 3.15c: In figure 3.15c, a graph of intersecting demand and supply curves represents a rising demand for Blu-ray players.
Long description for Figure 3.15c: The x-axis is labelled, Quantity and the y-axis is labelled, as Price.Curve D1 is a straight line which slopes down from the top left corner to the bottom right corner.Curve S1 is a straight line which slopes up from the bottom left to the top right.The point of intersection is at the midpoints of both lines.Curve D2 is a straight line, parallel to curve D1, but plotted to the right.A right pointing arrow indicates the change from D1 to D2.
Alt text for Figure 3.15d: In figure 3.15d, a graph of intersecting demand and supply curves represents a falling demand for Blu-ray disc players.
Long description for Figure 3.15d: The x-axis is labelled, Quantity and the y-axis is labelled, as Price.Curve D1 is a straight line which slopes down from the top left corner to the bottom right corner.Curve S1 is a straight line which slopes up from the bottom left to the top right.The point of intersection is at the midpoints of both lines.Curve D2 is a straight line, parallel to curve D1, but plotted to the left.A left pointing arrow indicates the change from D1 to D2.
-Refer to Figure 3.15.Assume that the graphs in this figure represent the demand and supply curves for laptop computers.Which panel best describes what happens in this market when the price of computer hard drives falls?
(Multiple Choice)
4.8/5 (37)
Figure 3.4 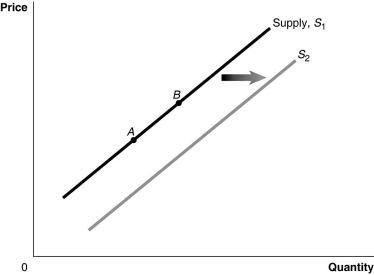 Alt text for Figure 3.4: In figure 3.4, a graph of the effect of technological advancement on supply curve.
Long description for Figure 3.4: The x-axis is labelled, Quantity, and the y-axis is labelled, Price.Curve Supply, S1, is a straight line which slopes up from the bottom left corner to the top right corner.2 points, A and B, are marked in the middle of curve S1.Curve S2 follows the same slope as curve S1, but is plotted to the right.A right pointing arrow indicates the change from curve S1 to curve S2.
-Refer to Figure 3.4.A technological advancement would be represented by a movement from
Alt text for Figure 3.4: In figure 3.4, a graph of the effect of technological advancement on supply curve.
Long description for Figure 3.4: The x-axis is labelled, Quantity, and the y-axis is labelled, Price.Curve Supply, S1, is a straight line which slopes up from the bottom left corner to the top right corner.2 points, A and B, are marked in the middle of curve S1.Curve S2 follows the same slope as curve S1, but is plotted to the right.A right pointing arrow indicates the change from curve S1 to curve S2.
-Refer to Figure 3.4.A technological advancement would be represented by a movement from
(Multiple Choice)
4.9/5 (29)
In September, buyers of silver expect that the price of silver will rise in October.What will happen in the silver market in September, holding all else constant?
(Multiple Choice)
4.8/5 (36)
The ________ effect of a price change refers to the impact a change in the price of a good has on a consumer's purchasing power.
(Multiple Choice)
4.8/5 (49)
The law of demand implies, holding everything else constant, that
(Multiple Choice)
5.0/5 (36)
What is the difference between an "increase in demand" and an "increase in quantity demanded"?
(Multiple Choice)
4.8/5 (37)
If a decrease in income leads to in a decrease in the demand for ice cream, then ice cream is
(Multiple Choice)
4.9/5 (31)
If, in response to a decrease in the price of coffee, the quantity demanded of coffee increases, economists would describe this as
(Multiple Choice)
4.9/5 (40)
"The price of digital cameras fell because of improvements in production technology.As a result, the demand for film cameras decreased.This caused the price of film cameras to fall; as the price of film cameras fell, the demand for film cameras decreased even further." Evaluate this statement.
(Multiple Choice)
4.8/5 (32)
If Canada removed the additional taxes it currently charges on French cheese, what would happen in the Canadian market for French cheese?
(Multiple Choice)
4.7/5 (51)
All else equal, an increase in the number of firms producing energy drinks will
(Multiple Choice)
4.8/5 (36)
An increase in the number of firms in a market will cause the quantity of a good supplied to increase.
(True/False)
4.8/5 (30)
Filters
- Essay(0)
- Multiple Choice(0)
- Short Answer(0)
- True False(0)
- Matching(0)