Exam 3: Where Prices Come From: The Interaction of Supply and Demand
Exam 1: Economics: Foundations and Models148 Questions
Exam 2: Trade-Offs, Comparative Advantage, and the Market System314 Questions
Exam 3: Where Prices Come From: The Interaction of Supply and Demand314 Questions
Exam 4: GDP: Measuring Total Production and Income277 Questions
Exam 5: Unemployment and Inflation300 Questions
Exam 6: Economic Growth, The Financial System, and Business Cycles262 Questions
Exam 7: Long-Run Economic Growth: Sources and Policies280 Questions
Exam 8: Aggregate Expenditure and Output in the Short Run315 Questions
Exam 9: Aggregate Demand and Aggregate Supply Analysis246 Questions
Exam 10: Money, Banks, and the Bank of Canada285 Questions
Exam 11: Monetary Policy281 Questions
Exam 12: Fiscal Policy303 Questions
Exam 13: Inflation, Unemployment, and Bank of Canada Policy265 Questions
Exam 14: Macroeconomics in an Open Economy280 Questions
Exam 15: The International Financial System228 Questions
Select questions type
Figure 3.11 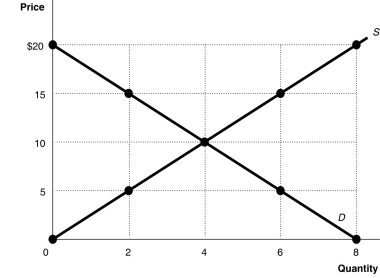 Alt text for Figure 3.11: In figure 3.11, a graph plotting intersecting supply and demand curves illustrates how supply and demand function in competitive markets.
Long description for Figure 3.11: The x-axis is labelled, Quantity, and is marked from 0 to 8 in increments of 2.The y-axis is labelled, Price, and is marked from 0 to 20 dollars in increments of 5.Curve D is a straight line which slopes down from the top left corner to the bottom right corner.Curve S is a straight line which begins in the bottom left corner and slopes up to the top right corner.The equilibrium of the 2 curves is marked at (4,10).2 points plotted on the demand curve to the left of the equilibrium are (0,20)and (2,15).2 points plotted on the demand curve to the right of the equilibrium are (6,5)and (8,0).2 points plotted on the supply curve to the right of the equilibrium are (6,15)and (8,20).2 points plotted on the supply curve to the left of the equilibrium are (2,5)and (0,0).
-Refer to Figure 3.11.In a free market such as that depicted above, a shortage is eliminated by
Alt text for Figure 3.11: In figure 3.11, a graph plotting intersecting supply and demand curves illustrates how supply and demand function in competitive markets.
Long description for Figure 3.11: The x-axis is labelled, Quantity, and is marked from 0 to 8 in increments of 2.The y-axis is labelled, Price, and is marked from 0 to 20 dollars in increments of 5.Curve D is a straight line which slopes down from the top left corner to the bottom right corner.Curve S is a straight line which begins in the bottom left corner and slopes up to the top right corner.The equilibrium of the 2 curves is marked at (4,10).2 points plotted on the demand curve to the left of the equilibrium are (0,20)and (2,15).2 points plotted on the demand curve to the right of the equilibrium are (6,5)and (8,0).2 points plotted on the supply curve to the right of the equilibrium are (6,15)and (8,20).2 points plotted on the supply curve to the left of the equilibrium are (2,5)and (0,0).
-Refer to Figure 3.11.In a free market such as that depicted above, a shortage is eliminated by
(Multiple Choice)
4.7/5  (45)
(45)
"The price of compact LED lights fell because of improvements in production technology.As a result, the demand for incandescent light bulbs decreased.This caused the price of incandescent light bulbs to fall; as the price of incandescent light bulbs fell the demand for incandescent light bulbs decreased even further." Evaluate this statement.
(Multiple Choice)
4.9/5 (43)
Figure 3.9 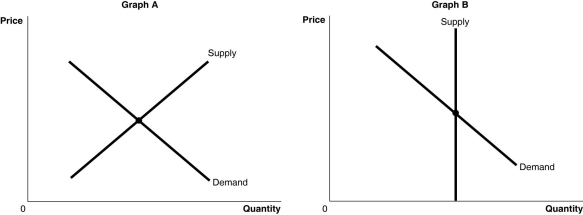 Alt text for Figure 3.9a: In figure 3.9a, a graph plotting intersecting supply and demand curves represents one of the two markets for original Michelangelo sculptures and Ray Ban sunglasses.
Long description for Figure 3.9a: The x-axis is labelled, Quantity, and the y-axis is labelled, Price.Curve Supply is a straight line which slopes up from the bottom left corner to the top right corner.Curve Demand is a straight line which slopes down from the top left corner to the bottom right corner.The 2 curves intersect at their respective midpoints.
Alt text for Figure 3.9b: In figure 3.9b, a graph plotting intersecting supply and demand curves represents one of the two markets for original Michelangelo sculptures and Ray Ban sunglasses.
Long description for Figure 3.9b: The x-axis is labelled, Quantity, and the y-axis is labelled, Price.Curve Demand is a straight line which slopes down from the top left corner to the bottom right corner.Curve Supply is a straight vertical line which begins from the midpoint of the x axis.The 2 curves intersect at their respective midpoints.
-Refer to Figure 3.9.The figure above shows the supply and demand curves for two markets: the market for original Michelangelo sculptures and the market for Ray Ban sunglasses.Which graph most likely represents which market?
Alt text for Figure 3.9a: In figure 3.9a, a graph plotting intersecting supply and demand curves represents one of the two markets for original Michelangelo sculptures and Ray Ban sunglasses.
Long description for Figure 3.9a: The x-axis is labelled, Quantity, and the y-axis is labelled, Price.Curve Supply is a straight line which slopes up from the bottom left corner to the top right corner.Curve Demand is a straight line which slopes down from the top left corner to the bottom right corner.The 2 curves intersect at their respective midpoints.
Alt text for Figure 3.9b: In figure 3.9b, a graph plotting intersecting supply and demand curves represents one of the two markets for original Michelangelo sculptures and Ray Ban sunglasses.
Long description for Figure 3.9b: The x-axis is labelled, Quantity, and the y-axis is labelled, Price.Curve Demand is a straight line which slopes down from the top left corner to the bottom right corner.Curve Supply is a straight vertical line which begins from the midpoint of the x axis.The 2 curves intersect at their respective midpoints.
-Refer to Figure 3.9.The figure above shows the supply and demand curves for two markets: the market for original Michelangelo sculptures and the market for Ray Ban sunglasses.Which graph most likely represents which market?
(Multiple Choice)
4.9/5 (43)
Auctions in recent years have resulted in higher prices paid for Jacques Plante (goalie )hockey cards than Sidney Crosby (forward )rookie cards.What is a reason for this difference in price?
(Multiple Choice)
4.9/5 (44)
The demand for lobster is higher at Christmas than in February.If the equilibrium price of lobster is lower at Christmas than in February, then
(Multiple Choice)
4.8/5 (50)
Let D = demand, S = supply, P = equilibrium price, Q = equilibrium quantity.What happens in the market for tropical hardwood trees if the governments restrict the amount of forest lands that can be logged?
(Multiple Choice)
5.0/5 (34)
Select the phrase that correctly completes the following statement."A decrease in the number of manufacturers caused a decrease in the supply of sailboats.As a result, ________."
(Multiple Choice)
5.0/5 (31)
New technology which would allow ordinary windows to be replaced with solar cells would have what impact on the market for solar electricity, all else equal?
(Multiple Choice)
4.9/5 (28)
It becomes common knowledge that planting mustard helps protect potato crops from numerous diseases. As a result we would expect
(Multiple Choice)
4.8/5 (34)
Which of the following would cause both the equilibrium price and equilibrium quantity of ramen to increase? Assume that ramen is an inferior good.
(Multiple Choice)
4.9/5 (38)
Assume that both the demand curve and the supply curve for smart phones shift to the right but the demand curve shifts more than the supply curve.As a result
(Multiple Choice)
4.9/5 (35)
Alberta ranchers can raise either cattle or sheep on their land.Which of the following would cause the supply of sheep to increase?
(Multiple Choice)
4.8/5 (39)
Let D = demand, S = supply, P = equilibrium price, Q = equilibrium quantity.What happens in the market for solar panels if the government offers tax breaks to encourage manufacturers to produce more solar panels?
(Multiple Choice)
4.7/5 (37)
Figure 3.13 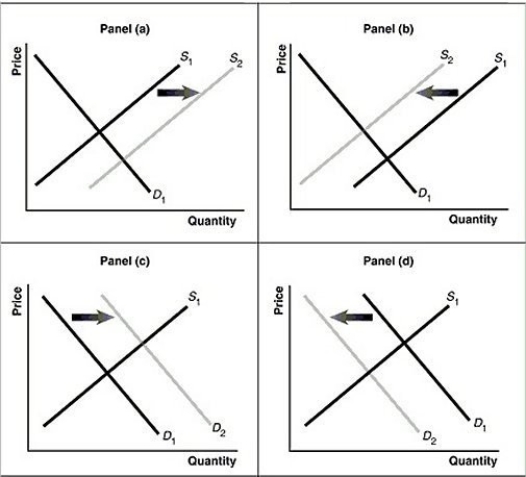 Alt text for Figure 3.13a: In figure 3.13a, a graph of intersecting demand and supply curves represents a rising supply of bicycle helmets.
Long description for Figure 3.13a: The x-axis is labelled, Quantity and the y-axis is labelled, as Price.Curve D1 is a straight line which slopes down from the top left corner to the bottom right corner.Curve S1 is a straight line which slopes up from the bottom left to the top right.The point of intersection is at the midpoints of both lines.Curve S2 is a straight line, parallel to curve S1, but plotted to the right.A right pointing arrow indicates the change from S1 to S2.
Alt text for Figure 3.13b: In figure 3.13b, a graph of intersecting demand and supply curves represents a falling supply of bicycle helmets.
Long description for Figure 3.13b: The x-axis is labelled, Quantity and the y-axis is labelled, as Price.Curve D1 is a straight line which slopes down from the top left corner to the bottom right corner.Curve S1 is a straight line which slopes up from the bottom left to the top right.The point of intersection is at the midpoints of both lines.Curve S2 is a straight line, parallel to curve S1, but plotted to the left.A left pointing arrow indicates the change from S1 to S2.
Alt text for Figure 3.13c: In figure 3.13c, a graph of intersecting demand and supply curves represents a rising demand for bicycle helmets.
Long description for Figure 3.13c: The x-axis is labelled, Quantity and the y-axis is labelled, as Price.Curve D1 is a straight line which slopes down from the top left corner to the bottom right corner.Curve S1 is a straight line which slopes up from the bottom left to the top right.The point of intersection is at the midpoints of both lines.Curve D2 is a straight line, parallel to curve D1, but plotted to the right.A right pointing arrow indicates the change from D1 to D2.
Alt text for Figure 3.13d: In figure 3.13d, a graph of intersecting demand and supply curves represents a falling demand for bicycle helmets.
Long description for Figure 3.13d: The x-axis is labelled, Quantity and the y-axis is labelled, as Price.Curve D1 is a straight line which slopes down from the top left corner to the bottom right corner.Curve S1 is a straight line which slopes up from the bottom left to the top right.The point of intersection is at the midpoints of both lines.Curve D2 is a straight line, parallel to curve D1, but plotted to the left.A left pointing arrow indicates the change from D1 to D2.
-Refer to Figure 3.13.Assume that the graphs in this figure represent the demand and supply curves for bicycle helmets.Which panel best describes what happens in this market if there is a substantial increase in the price of bicycles?
Alt text for Figure 3.13a: In figure 3.13a, a graph of intersecting demand and supply curves represents a rising supply of bicycle helmets.
Long description for Figure 3.13a: The x-axis is labelled, Quantity and the y-axis is labelled, as Price.Curve D1 is a straight line which slopes down from the top left corner to the bottom right corner.Curve S1 is a straight line which slopes up from the bottom left to the top right.The point of intersection is at the midpoints of both lines.Curve S2 is a straight line, parallel to curve S1, but plotted to the right.A right pointing arrow indicates the change from S1 to S2.
Alt text for Figure 3.13b: In figure 3.13b, a graph of intersecting demand and supply curves represents a falling supply of bicycle helmets.
Long description for Figure 3.13b: The x-axis is labelled, Quantity and the y-axis is labelled, as Price.Curve D1 is a straight line which slopes down from the top left corner to the bottom right corner.Curve S1 is a straight line which slopes up from the bottom left to the top right.The point of intersection is at the midpoints of both lines.Curve S2 is a straight line, parallel to curve S1, but plotted to the left.A left pointing arrow indicates the change from S1 to S2.
Alt text for Figure 3.13c: In figure 3.13c, a graph of intersecting demand and supply curves represents a rising demand for bicycle helmets.
Long description for Figure 3.13c: The x-axis is labelled, Quantity and the y-axis is labelled, as Price.Curve D1 is a straight line which slopes down from the top left corner to the bottom right corner.Curve S1 is a straight line which slopes up from the bottom left to the top right.The point of intersection is at the midpoints of both lines.Curve D2 is a straight line, parallel to curve D1, but plotted to the right.A right pointing arrow indicates the change from D1 to D2.
Alt text for Figure 3.13d: In figure 3.13d, a graph of intersecting demand and supply curves represents a falling demand for bicycle helmets.
Long description for Figure 3.13d: The x-axis is labelled, Quantity and the y-axis is labelled, as Price.Curve D1 is a straight line which slopes down from the top left corner to the bottom right corner.Curve S1 is a straight line which slopes up from the bottom left to the top right.The point of intersection is at the midpoints of both lines.Curve D2 is a straight line, parallel to curve D1, but plotted to the left.A left pointing arrow indicates the change from D1 to D2.
-Refer to Figure 3.13.Assume that the graphs in this figure represent the demand and supply curves for bicycle helmets.Which panel best describes what happens in this market if there is a substantial increase in the price of bicycles?
(Multiple Choice)
4.8/5 (33)
When deciding on which new products to develop, a firm must devote people, time, and money to designing a new product.Because any firm has only limited resources, it
(Multiple Choice)
4.7/5 (39)
Technological advancements have led to lower prices and an increase in sales of colour laser printers.How will this affect the market for laser printer toner cartridges?
(Multiple Choice)
4.7/5 (36)
At auction experts expect a Jacques Plante hockey card to get a higher price than Sidney Crosby's rookie card.Which of the following events would cause the price difference in these cards to get smaller?
(Multiple Choice)
4.9/5 (31)
In recent years the cost of producing organic produce in Canada has decreased largely due to technological advancement.At the same time, more and more Canadians prefer organic produce over conventional produce.Which of the following best explains the effect of these events in the organic produce market?
(Multiple Choice)
4.9/5 (36)
Figure 3.11 Alt text for Figure 3.11: In figure 3.11, a graph plotting intersecting supply and demand curves illustrates how supply and demand function in competitive markets.
Long description for Figure 3.11: The x-axis is labelled, Quantity, and is marked from 0 to 8 in increments of 2.The y-axis is labelled, Price, and is marked from 0 to 20 dollars in increments of 5.Curve D is a straight line which slopes down from the top left corner to the bottom right corner.Curve S is a straight line which begins in the bottom left corner and slopes up to the top right corner.The equilibrium of the 2 curves is marked at (4,10).2 points plotted on the demand curve to the left of the equilibrium are (0,20)and (2,15).2 points plotted on the demand curve to the right of the equilibrium are (6,5)and (8,0).2 points plotted on the supply curve to the right of the equilibrium are (6,15)and (8,20).2 points plotted on the supply curve to the left of the equilibrium are (2,5)and (0,0).
-Refer to Figure 3.11.At a price of $15, the quantity sold
(Multiple Choice)
4.8/5 (36)
"Because Coke and Pepsi are substitutes, a decrease in the price of Pepsi will cause the demand for Coke to decrease.This initial shift in demand for Coke results in a lower price for Coke; this lower price will cause the demand curve for Coke to shift to the left." Which of the following correctly comments on this statement?
(Multiple Choice)
4.8/5 (45)
Filters
- Essay(0)
- Multiple Choice(0)
- Short Answer(0)
- True False(0)
- Matching(0)