Exam 3: Where Prices Come From: The Interaction of Supply and Demand
Exam 1: Economics: Foundations and Models148 Questions
Exam 2: Trade-Offs, Comparative Advantage, and the Market System314 Questions
Exam 3: Where Prices Come From: The Interaction of Supply and Demand314 Questions
Exam 4: GDP: Measuring Total Production and Income277 Questions
Exam 5: Unemployment and Inflation300 Questions
Exam 6: Economic Growth, The Financial System, and Business Cycles262 Questions
Exam 7: Long-Run Economic Growth: Sources and Policies280 Questions
Exam 8: Aggregate Expenditure and Output in the Short Run315 Questions
Exam 9: Aggregate Demand and Aggregate Supply Analysis246 Questions
Exam 10: Money, Banks, and the Bank of Canada285 Questions
Exam 11: Monetary Policy281 Questions
Exam 12: Fiscal Policy303 Questions
Exam 13: Inflation, Unemployment, and Bank of Canada Policy265 Questions
Exam 14: Macroeconomics in an Open Economy280 Questions
Exam 15: The International Financial System228 Questions
Select questions type
If guarana (a key ingredient in many energy drinks)becomes less expensive, we would expect
(Multiple Choice)
4.9/5  (40)
(40)
Which of the following is expected to occur as the baby-boom generation ages?
(Multiple Choice)
4.8/5 (36)
Figure 3.1 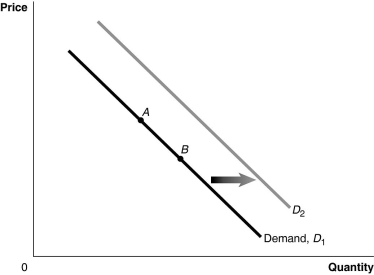 Alt text for Figure 3.1: In figure 3.1, graph of the effect of an increase in population on the demand curve.
Long description for Figure 3.1: The x-axis is labelled, Quantity, and y-axis is labelled, Price.Curve Demand, D1, is a straight line which slopes down from the top left corner to the bottom right corner.Curve D2 follows the same slope as curve D1, but is plotted to the right.2 points, A and B, are plotted in the middle of curve D1.A right pointing arrow indicates the change from curve D1 to curve D2.
-Refer to Figure 3.1.A case in which consumers no longer cared for a product would be represented by a movement from
Alt text for Figure 3.1: In figure 3.1, graph of the effect of an increase in population on the demand curve.
Long description for Figure 3.1: The x-axis is labelled, Quantity, and y-axis is labelled, Price.Curve Demand, D1, is a straight line which slopes down from the top left corner to the bottom right corner.Curve D2 follows the same slope as curve D1, but is plotted to the right.2 points, A and B, are plotted in the middle of curve D1.A right pointing arrow indicates the change from curve D1 to curve D2.
-Refer to Figure 3.1.A case in which consumers no longer cared for a product would be represented by a movement from
(Multiple Choice)
4.9/5 (43)
Table 3.5  -Refer to Table 3.5.The equations above describe the demand and supply for Aunt Maud's Premium Hand Lotion.The equilibrium price and quantity for Aunt Maud's lotion are $20 and 30 thousand units.What is the value of consumer surplus?
(Multiple Choice)
4.9/5 (45)
Figure 3.10 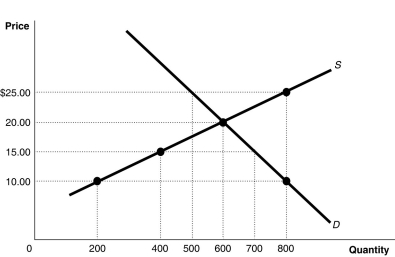 Alt text for Figure 3.10: In figure 3.10, a graph plotting intersecting supply and demand curves illustrates how supply and demand function in competitive markets.
Long description for Figure 3.10: The x-axis is labelled, Quantity, with the values 0, 200, 400, 500, 600, 700 and 800 marked.The y-axis is labelled, Price, with the values 0, 10.00, 15.00, 20.00 and 25.00 dollars marked.Supply Curve S is a straight line which slopes up from the bottom left corner to the top right corner.4 points are plotted along the curve; (200, 10), (400, 15), (600, 20), and (800, 25).Demand curve D is a straight line which slopes down from the top left corner to the bottom right corner.Curve D intersects the S curve at (600, 20), and passes through another point, (800, 10).All plotted points are connected to the corresponding values on the x and y-axis with dotted lines.
-Refer to Figure 3.10.If the current market price is $25, the market will achieve equilibrium through
Alt text for Figure 3.10: In figure 3.10, a graph plotting intersecting supply and demand curves illustrates how supply and demand function in competitive markets.
Long description for Figure 3.10: The x-axis is labelled, Quantity, with the values 0, 200, 400, 500, 600, 700 and 800 marked.The y-axis is labelled, Price, with the values 0, 10.00, 15.00, 20.00 and 25.00 dollars marked.Supply Curve S is a straight line which slopes up from the bottom left corner to the top right corner.4 points are plotted along the curve; (200, 10), (400, 15), (600, 20), and (800, 25).Demand curve D is a straight line which slopes down from the top left corner to the bottom right corner.Curve D intersects the S curve at (600, 20), and passes through another point, (800, 10).All plotted points are connected to the corresponding values on the x and y-axis with dotted lines.
-Refer to Figure 3.10.If the current market price is $25, the market will achieve equilibrium through
(Multiple Choice)
4.8/5 (37)
For each of the following pairs of products, state which are complements, which are substitutes, and which are unrelated.
a.digital camera and memory stick
b.7Up and Mountain Dew
c.swimsuits and flip-flops
d.Tylenol and cat food
e.photocopier and paper
(Essay)
4.8/5 (32)
Digital video recorders (DVRs or PVRs)were introduced to the market in 1999, and new technology has allowed for the cost of manufacturing the recorders to decline significantly since their initial introduction.How did this change in technology affect the market for DVRs?
(Multiple Choice)
4.9/5 (40)
Danielle Ocean pays for monthly pool maintenance for her home swimming pool.Last week the owner of the pool service informed Danielle that she will have to raise her monthly service fee because of increases in the price of pool chemicals.How is the market for pool maintenance services affected by this?
(Multiple Choice)
4.9/5 (44)
Figure 3.13 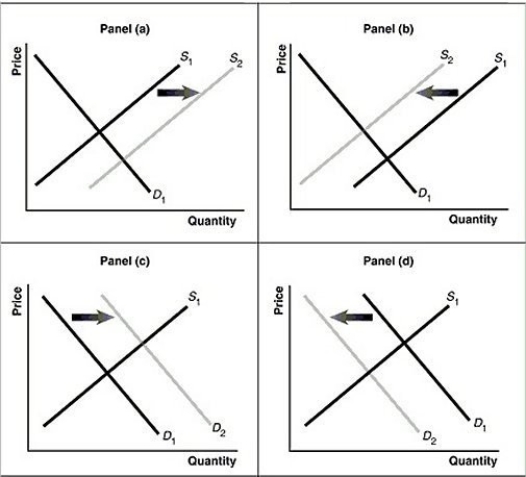 Alt text for Figure 3.13a: In figure 3.13a, a graph of intersecting demand and supply curves represents a rising supply of bicycle helmets.
Long description for Figure 3.13a: The x-axis is labelled, Quantity and the y-axis is labelled, as Price.Curve D1 is a straight line which slopes down from the top left corner to the bottom right corner.Curve S1 is a straight line which slopes up from the bottom left to the top right.The point of intersection is at the midpoints of both lines.Curve S2 is a straight line, parallel to curve S1, but plotted to the right.A right pointing arrow indicates the change from S1 to S2.
Alt text for Figure 3.13b: In figure 3.13b, a graph of intersecting demand and supply curves represents a falling supply of bicycle helmets.
Long description for Figure 3.13b: The x-axis is labelled, Quantity and the y-axis is labelled, as Price.Curve D1 is a straight line which slopes down from the top left corner to the bottom right corner.Curve S1 is a straight line which slopes up from the bottom left to the top right.The point of intersection is at the midpoints of both lines.Curve S2 is a straight line, parallel to curve S1, but plotted to the left.A left pointing arrow indicates the change from S1 to S2.
Alt text for Figure 3.13c: In figure 3.13c, a graph of intersecting demand and supply curves represents a rising demand for bicycle helmets.
Long description for Figure 3.13c: The x-axis is labelled, Quantity and the y-axis is labelled, as Price.Curve D1 is a straight line which slopes down from the top left corner to the bottom right corner.Curve S1 is a straight line which slopes up from the bottom left to the top right.The point of intersection is at the midpoints of both lines.Curve D2 is a straight line, parallel to curve D1, but plotted to the right.A right pointing arrow indicates the change from D1 to D2.
Alt text for Figure 3.13d: In figure 3.13d, a graph of intersecting demand and supply curves represents a falling demand for bicycle helmets.
Long description for Figure 3.13d: The x-axis is labelled, Quantity and the y-axis is labelled, as Price.Curve D1 is a straight line which slopes down from the top left corner to the bottom right corner.Curve S1 is a straight line which slopes up from the bottom left to the top right.The point of intersection is at the midpoints of both lines.Curve D2 is a straight line, parallel to curve D1, but plotted to the left.A left pointing arrow indicates the change from D1 to D2.
-Refer to Figure 3.13.Assume that the graphs in this figure represent the demand and supply curves for Fruitopia, a soft drink.Which panel describes what happens in the market for Fruitopia when the price of Snapple, a substitute product, decreases?
Alt text for Figure 3.13a: In figure 3.13a, a graph of intersecting demand and supply curves represents a rising supply of bicycle helmets.
Long description for Figure 3.13a: The x-axis is labelled, Quantity and the y-axis is labelled, as Price.Curve D1 is a straight line which slopes down from the top left corner to the bottom right corner.Curve S1 is a straight line which slopes up from the bottom left to the top right.The point of intersection is at the midpoints of both lines.Curve S2 is a straight line, parallel to curve S1, but plotted to the right.A right pointing arrow indicates the change from S1 to S2.
Alt text for Figure 3.13b: In figure 3.13b, a graph of intersecting demand and supply curves represents a falling supply of bicycle helmets.
Long description for Figure 3.13b: The x-axis is labelled, Quantity and the y-axis is labelled, as Price.Curve D1 is a straight line which slopes down from the top left corner to the bottom right corner.Curve S1 is a straight line which slopes up from the bottom left to the top right.The point of intersection is at the midpoints of both lines.Curve S2 is a straight line, parallel to curve S1, but plotted to the left.A left pointing arrow indicates the change from S1 to S2.
Alt text for Figure 3.13c: In figure 3.13c, a graph of intersecting demand and supply curves represents a rising demand for bicycle helmets.
Long description for Figure 3.13c: The x-axis is labelled, Quantity and the y-axis is labelled, as Price.Curve D1 is a straight line which slopes down from the top left corner to the bottom right corner.Curve S1 is a straight line which slopes up from the bottom left to the top right.The point of intersection is at the midpoints of both lines.Curve D2 is a straight line, parallel to curve D1, but plotted to the right.A right pointing arrow indicates the change from D1 to D2.
Alt text for Figure 3.13d: In figure 3.13d, a graph of intersecting demand and supply curves represents a falling demand for bicycle helmets.
Long description for Figure 3.13d: The x-axis is labelled, Quantity and the y-axis is labelled, as Price.Curve D1 is a straight line which slopes down from the top left corner to the bottom right corner.Curve S1 is a straight line which slopes up from the bottom left to the top right.The point of intersection is at the midpoints of both lines.Curve D2 is a straight line, parallel to curve D1, but plotted to the left.A left pointing arrow indicates the change from D1 to D2.
-Refer to Figure 3.13.Assume that the graphs in this figure represent the demand and supply curves for Fruitopia, a soft drink.Which panel describes what happens in the market for Fruitopia when the price of Snapple, a substitute product, decreases?
(Multiple Choice)
4.9/5 (33)
Buyers rush to purchase stocks in Ontario vineyards following a forecast of a 30 percent decline in this year's grape harvest.What happens in the Ontario wine market as a result of this announcement?
(Multiple Choice)
4.7/5 (36)
Photovoltaic cells (solar panels)have been in use since the 1970s. Recently, new technology has been developed which some think will allow regular windows to be replaced with solar panels. If this technology works as these people expect what will happen in the market for solar energy?
(Multiple Choice)
4.9/5 (36)
A decrease in the demand for eggs due to changes in consumer tastes, accompanied by a decrease in the supply of eggs as a result of an outbreak of Avian flu, will result in
(Multiple Choice)
4.9/5 (38)
Table 3.2  -Refer to Table 3.2.The table above shows the demand schedules for Kona coffee of two individuals (Luke and Ravi)and the rest of the market.If the price of Kona coffee rises from $4 to $5, the market quantity demanded would
(Multiple Choice)
4.9/5 (38)
What is the difference between a "change in demand" and a "change in quantity demanded"?
(Essay)
4.7/5 (44)
If, in the market for oranges, the supply has increased, then
(Multiple Choice)
4.8/5 (38)
An increase in the equilibrium price for a product will result
(Multiple Choice)
4.8/5 (32)
If consumers view tablet computers as good replacements for ________, demand will most likely be greater than if consumers view tablet computers as good replacements for ________.
(Multiple Choice)
4.7/5 (28)
What is the law of supply? What does this law imply about the shape of the supply curve?
(Essay)
4.9/5 (33)
Filters
- Essay(0)
- Multiple Choice(0)
- Short Answer(0)
- True False(0)
- Matching(0)