Exam 3: Where Prices Come From: The Interaction of Supply and Demand
Exam 1: Economics: Foundations and Models148 Questions
Exam 2: Trade-Offs, Comparative Advantage, and the Market System314 Questions
Exam 3: Where Prices Come From: The Interaction of Supply and Demand314 Questions
Exam 4: GDP: Measuring Total Production and Income277 Questions
Exam 5: Unemployment and Inflation300 Questions
Exam 6: Economic Growth, The Financial System, and Business Cycles262 Questions
Exam 7: Long-Run Economic Growth: Sources and Policies280 Questions
Exam 8: Aggregate Expenditure and Output in the Short Run315 Questions
Exam 9: Aggregate Demand and Aggregate Supply Analysis246 Questions
Exam 10: Money, Banks, and the Bank of Canada285 Questions
Exam 11: Monetary Policy281 Questions
Exam 12: Fiscal Policy303 Questions
Exam 13: Inflation, Unemployment, and Bank of Canada Policy265 Questions
Exam 14: Macroeconomics in an Open Economy280 Questions
Exam 15: The International Financial System228 Questions
Select questions type
Table 3.5  -Refer to Table 3.5.The equations above describe the demand and supply for Aunt Maud's Premium Hand Lotion.The equilibrium price and quantity for Aunt Maud's lotion are $20 and 30 thousand units. What is the value of producer surplus?
(Multiple Choice)
4.9/5  (40)
(40)
Suppose that when the price of hamburgers decreases, the Li family increases their purchases of ketchup.To the Li family
(Multiple Choice)
4.9/5 (44)
One would speak of a movement along a supply curve for a good, rather than a change in supply, if
(Multiple Choice)
4.7/5 (40)
Figure 3.16  Alt text for Figure 3.16: In figure 3.16, a graph plotting intersecting demand and supply curves represents the change in equilibrium point in the motorcycle market with the increase in price of engines and wages of motorcycle manufacturers.
Long description for Figure 3.16: The x-axis is labelled, Quantity and the y-axis is labelled, Price.Curve D1 is a straight line which slopes down from the top left corner to the bottom right corner.Curve D2 is parallel with curve D1, but is plotted to the left.Curve S1 is a straight line which slopes up from the bottom right corner to the top left corner.Curve S2 is parallel to curve S1, but is plotted to the left.The 4 curves intersect at 4 points; A, B, on the right side of the lines, and C and D, on the left sides of the lines
-Refer to Figure 3.16.The graph in this figure illustrates an initial competitive equilibrium in the market for motorcycles at the intersection of D1 and S1 (point
Alt text for Figure 3.16: In figure 3.16, a graph plotting intersecting demand and supply curves represents the change in equilibrium point in the motorcycle market with the increase in price of engines and wages of motorcycle manufacturers.
Long description for Figure 3.16: The x-axis is labelled, Quantity and the y-axis is labelled, Price.Curve D1 is a straight line which slopes down from the top left corner to the bottom right corner.Curve D2 is parallel with curve D1, but is plotted to the left.Curve S1 is a straight line which slopes up from the bottom right corner to the top left corner.Curve S2 is parallel to curve S1, but is plotted to the left.The 4 curves intersect at 4 points; A, B, on the right side of the lines, and C and D, on the left sides of the lines
-Refer to Figure 3.16.The graph in this figure illustrates an initial competitive equilibrium in the market for motorcycles at the intersection of D1 and S1 (point
(Multiple Choice)
4.9/5 (41)
Figure 3.14 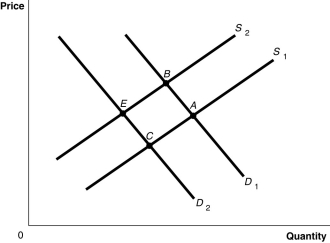 Alt text for Figure 3.14: In figure 3.14, a graph plotting intersecting demand and supply curves represents the change in equilibrium point in the apple market with the decrease in the price of a substitute fruit, orange and the increase in the wages of apple workers.
Long description for Figure 3.14: The x-axis is labelled, Quantity and the y-axis is labelled, Price.Curve D1 is a straight line which slopes down from the top left corner to the bottom right corner.Curve D2 is parallel with curve D1, but is plotted to the left.Curve S1 is a straight line which slopes up from the bottom right corner to the top left corner.Curve S2 is parallel to curve S1, but is plotted to the left.The 4 curves intersect at 4 points; A, B, on the right side of the lines, and C and D, on the left sides of the lines.
-Refer to Figure 3.14.The graph in this figure illustrates an initial competitive equilibrium in the market for apples at the intersection of D1 and S1 (point
Alt text for Figure 3.14: In figure 3.14, a graph plotting intersecting demand and supply curves represents the change in equilibrium point in the apple market with the decrease in the price of a substitute fruit, orange and the increase in the wages of apple workers.
Long description for Figure 3.14: The x-axis is labelled, Quantity and the y-axis is labelled, Price.Curve D1 is a straight line which slopes down from the top left corner to the bottom right corner.Curve D2 is parallel with curve D1, but is plotted to the left.Curve S1 is a straight line which slopes up from the bottom right corner to the top left corner.Curve S2 is parallel to curve S1, but is plotted to the left.The 4 curves intersect at 4 points; A, B, on the right side of the lines, and C and D, on the left sides of the lines.
-Refer to Figure 3.14.The graph in this figure illustrates an initial competitive equilibrium in the market for apples at the intersection of D1 and S1 (point
(Multiple Choice)
4.9/5 (36)
Which of the following would shift the supply curve for energy drinks to the left?
(Multiple Choice)
4.9/5 (33)
Assume there is a surplus in the market for hybrid automobiles.Which of the following statements correctly describes this situation?
(Multiple Choice)
4.8/5 (41)
If provinces decide to cover part of the price of voluntary laser eye surgery and more doctors decide to enter the field of laser eye surgery, what will happen in the market for laser eye surgery as a result of these two factors?
(Multiple Choice)
4.7/5 (38)
If, in the market for apples, the supply has decreased, then
(Multiple Choice)
4.8/5 (35)
In response to a surplus the market price of a good will fall; as the price falls, the quantity demanded will increase and quantity supplies will decrease until equilibrium is reached.
(True/False)
4.9/5 (34)
A surplus is defined as the situation that exists when the quantity of a good supplied is greater than the quantity demanded.
(True/False)
4.7/5 (34)
A positive technological change will cause the quantity supplied of a good to increase.
(True/False)
4.9/5 (38)
If a decrease in income leads to an increase in the demand for macaroni, then macaroni is
(Multiple Choice)
4.9/5 (37)
Figure 3.5 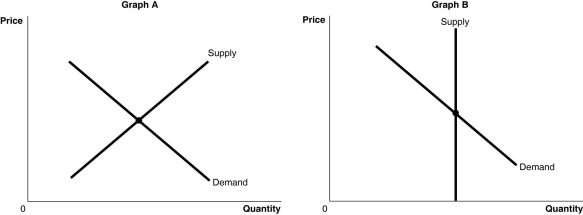 Alt text for Figure 3.5a: In figure 3.5a, a graph of intersecting supply and demand curves representing the markets for original Picasso paintings and designer jeans.
Long description for Figure 3.5a: The x-axis is labelled, Quantity, and the y-axis is labelled, Price.Curve Supply is a straight line which slopes up from the bottom left corner to the top right corner.Curve Demand is a straight line which slopes down from the top left corner to the bottom right corner.The 2 curves intersect at their respective midpoints.
Alt text for Figure 3.5b: In figure 3.5b, a graph of intersecting supply and demand curves represents one of the two markets for original Picasso paintings and designer jeans.
Long description for Figure 3.5b: The x-axis is labelled, Quantity, and the y-axis is labelled, Price.Curve Demand is a straight line which slopes down from the top left corner to the bottom right corner.Curve Supply is a straight, vertical line beginning from approximate midpoint of the x axis.The 2 curves intersect at their respective midpoints.
-Refer to Figure 3.5.The figure above shows the supply and demand curves for two markets: the market for original Picasso paintings and the market for designer jeans.Which graph most likely represents which market?
Alt text for Figure 3.5a: In figure 3.5a, a graph of intersecting supply and demand curves representing the markets for original Picasso paintings and designer jeans.
Long description for Figure 3.5a: The x-axis is labelled, Quantity, and the y-axis is labelled, Price.Curve Supply is a straight line which slopes up from the bottom left corner to the top right corner.Curve Demand is a straight line which slopes down from the top left corner to the bottom right corner.The 2 curves intersect at their respective midpoints.
Alt text for Figure 3.5b: In figure 3.5b, a graph of intersecting supply and demand curves represents one of the two markets for original Picasso paintings and designer jeans.
Long description for Figure 3.5b: The x-axis is labelled, Quantity, and the y-axis is labelled, Price.Curve Demand is a straight line which slopes down from the top left corner to the bottom right corner.Curve Supply is a straight, vertical line beginning from approximate midpoint of the x axis.The 2 curves intersect at their respective midpoints.
-Refer to Figure 3.5.The figure above shows the supply and demand curves for two markets: the market for original Picasso paintings and the market for designer jeans.Which graph most likely represents which market?
(Multiple Choice)
4.7/5 (41)
Which of the following describes a characteristic of a perfectly competitive market?
(Multiple Choice)
4.9/5 (38)
All else equal, a successful marketing campaign for energy drinks would cause the equilibrium price of energy drinks to ________ and the equilibrium quantity of energy drinks to ________.
(Multiple Choice)
4.8/5 (43)
Following the successful launch of Red Bull in the Canadian market in 2004, companies such as Coca Cola, Pepsi, and many others have introduced products to compete with Red Bull.The energy drinks introduced to compete with Red Bull would be considered
(Multiple Choice)
4.9/5 (39)
Figure 3.3 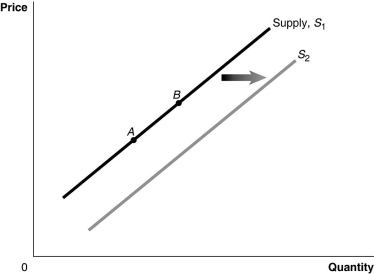 Alt text for Figure 3.3: In figure 3.3, a graph of the effect of an increase in the price of inputs on the supply curve.
Long description for Figure 3.3: The x-axis is labelled, Quantity, and the y-axis is labelled, Price.Curve Supply, S1, is a straight line which slopes up from the bottom left corner to the top right corner.2 points, A and B, are marked in the middle of curve S1.Curve S2 follows the same slope as curve S1, but is plotted to the right.A right pointing arrow indicates the change from curve S1 to curve S2.
-Refer to Figure 3.3.An increase in the number of firms in the market would be represented by a movement from
Alt text for Figure 3.3: In figure 3.3, a graph of the effect of an increase in the price of inputs on the supply curve.
Long description for Figure 3.3: The x-axis is labelled, Quantity, and the y-axis is labelled, Price.Curve Supply, S1, is a straight line which slopes up from the bottom left corner to the top right corner.2 points, A and B, are marked in the middle of curve S1.Curve S2 follows the same slope as curve S1, but is plotted to the right.A right pointing arrow indicates the change from curve S1 to curve S2.
-Refer to Figure 3.3.An increase in the number of firms in the market would be represented by a movement from
(Multiple Choice)
4.8/5 (41)
If in the market for blueberries, the supply curve has shifted to the left,
(Multiple Choice)
4.8/5 (36)
Filters
- Essay(0)
- Multiple Choice(0)
- Short Answer(0)
- True False(0)
- Matching(0)