Exam 7: Linear Regression
Exam 1: Data30 Questions
Exam 2: Displaying and Describing Categorical Data65 Questions
Exam 3: Displaying and Summarizing Quantitative Data93 Questions
Exam 4: Understanding and Comparing Distributions102 Questions
Exam 5: The Standard Deviation As a Ruler and the Normal Model131 Questions
Exam 6: Scatterplots, association, and Correlation74 Questions
Exam 7: Linear Regression57 Questions
Exam 8: Regression Wisdom32 Questions
Exam 9: Re-Expressing Data: Get It Straight51 Questions
Exam 10: Understanding Randomness26 Questions
Exam 11: Sample Surveys50 Questions
Exam 12: Experiments and Observational Surveys87 Questions
Exam 13: From Randomness to Probability64 Questions
Exam 14: Probability Rules90 Questions
Exam 15: Random Variables112 Questions
Exam 16: Probability Models114 Questions
Exam 17: Sampling Distribution Models45 Questions
Exam 18: Confidence Intervals for Proportions56 Questions
Exam 19: Testing Hypotheses About Proportions50 Questions
Exam 20: More About Tests69 Questions
Exam 21: Comparing Two Proportions52 Questions
Exam 22: Inferences About Means106 Questions
Exam 23: Comparing Means43 Questions
Exam 24: Paired Samples and Blocks33 Questions
Exam 25: Comparing Counts78 Questions
Exam 26: Inferences for Regression51 Questions
Exam 27: Analysis of Variance39 Questions
Exam 28: Multifactor Analysis of Variance22 Questions
Exam 29: Multiple Regression22 Questions
Exam 30: Multiple Regression Wisdom21 Questions
Exam 31: Rank-Based Nonparametric Tests29 Questions
Exam 32: The Bootstrap31 Questions
Select questions type
A random sample of records of electricity usage of homes gives the amount of electricity used in July and size (in square feet)of 135 homes.A regression was done to predict the amount of electricity used (in kilowatt-hours)from size.The residuals plot indicated that a linear model is appropriate.The model is  = 1,248 + 0.6 size.Explain what the slope of the line says about the electricity usage and home size.
(Multiple Choice)
4.8/5  (40)
(40)
A golf ball is dropped from 15 different heights (in cm)and the height of the bounce is recorded (in cm. )The regression analysis gives the model  = 0.3 + 0.71 drop.Interpret the meaning of the y-intercept.
(Multiple Choice)
4.8/5 (39)
Ten Jeep Cherokee classified ads were selected.The age and prices of several used Ford Escorts are given in the table. 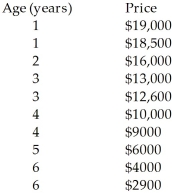
(Multiple Choice)
4.8/5 (41)
A random sample of records of electricity usage of homes gives the amount of electricity used in July and size (in square feet)of 135 homes.A regression was done to predict the amount of electricity used (in kilowatt-hours)from size.The residuals plot indicated that a linear model is appropriate.What units does the slope have?
(Multiple Choice)
4.8/5 (43)
A random sample of 150 yachts sold in Canada last year was taken.A regression to predict the price (in thousands of dollars)from length (in feet)has an  = 19.00%.What would you predict about the price of the yacht whose length was one standard deviation above the mean?
(Multiple Choice)
5.0/5 (37)
A biology student does a study to investigate the association between the amount of sunlight and the number of roses on a rosebush in one summer.(The  Value is 58%)He claims that the amount of sunlight determines 58% of the number of roses on a rosebush in one summer.
(Multiple Choice)
4.8/5 (40)
Using advertised prices for used Ford Escorts a linear model for the relationship between a car's age and its price is found.The regression has an  = 88.2%.Describe the relationship
(Multiple Choice)
4.9/5 (32)
A psychologist does an experiment to determine whether an outgoing person can be identified by his or her handwriting.She claims that the  Of 89% shows that this linear model is appropriate.
(Multiple Choice)
4.9/5 (38)
The relationship between the cost of a taxi ride (y)and the length of the ride (x)is analyzed.The mean length was 4.6 km with a standard deviation of 1.1.The mean cost was $8.70 with a standard deviation of 2.0.The correlation between the cost and the length was 0.81.
(Multiple Choice)
4.7/5 (39)
A golf ball is dropped from 15 different heights (in cm)and the height of the bounce is recorded (in cm. )The regression analysis gives the model  = 0.3 + 0.74 drop.A golf ball dropped from 61 cm bounced 46.44 cm.What is the residual for this bounce height.?
(Multiple Choice)
5.0/5 (42)
Ten students in a graduate program at Carleton University were randomly selected.Their grade point averages (GPAs)when they entered the program were between 11.5 and 12.0.The following data were obtained regarding their GPAs on entering the program versus their current GPAs. 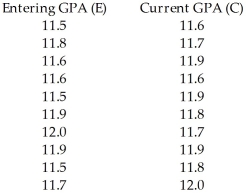
(Multiple Choice)
4.8/5 (35)
A random sample of records of electricity usage of homes gives the amount of electricity used in July and size (in square feet)of 135 homes.A regression was done to predict the amount of electricity used (in kilowatt-hours)from size.The residuals plot indicated that a linear model is appropriate.Do you think the slope is positive or negative? Why?
(Multiple Choice)
5.0/5 (33)
Filters
- Essay(0)
- Multiple Choice(0)
- Short Answer(0)
- True False(0)
- Matching(0)