Exam 9: Re-Expressing Data: Get It Straight
Exam 1: Data30 Questions
Exam 2: Displaying and Describing Categorical Data65 Questions
Exam 3: Displaying and Summarizing Quantitative Data93 Questions
Exam 4: Understanding and Comparing Distributions102 Questions
Exam 5: The Standard Deviation As a Ruler and the Normal Model131 Questions
Exam 6: Scatterplots, association, and Correlation74 Questions
Exam 7: Linear Regression57 Questions
Exam 8: Regression Wisdom32 Questions
Exam 9: Re-Expressing Data: Get It Straight51 Questions
Exam 10: Understanding Randomness26 Questions
Exam 11: Sample Surveys50 Questions
Exam 12: Experiments and Observational Surveys87 Questions
Exam 13: From Randomness to Probability64 Questions
Exam 14: Probability Rules90 Questions
Exam 15: Random Variables112 Questions
Exam 16: Probability Models114 Questions
Exam 17: Sampling Distribution Models45 Questions
Exam 18: Confidence Intervals for Proportions56 Questions
Exam 19: Testing Hypotheses About Proportions50 Questions
Exam 20: More About Tests69 Questions
Exam 21: Comparing Two Proportions52 Questions
Exam 22: Inferences About Means106 Questions
Exam 23: Comparing Means43 Questions
Exam 24: Paired Samples and Blocks33 Questions
Exam 25: Comparing Counts78 Questions
Exam 26: Inferences for Regression51 Questions
Exam 27: Analysis of Variance39 Questions
Exam 28: Multifactor Analysis of Variance22 Questions
Exam 29: Multiple Regression22 Questions
Exam 30: Multiple Regression Wisdom21 Questions
Exam 31: Rank-Based Nonparametric Tests29 Questions
Exam 32: The Bootstrap31 Questions
Select questions type
A rock is dropped from a tall building and its distance (in feet)below the point of release is recorded as accurately as possible at various times after the moment of release.The results are shown in the table.Use technology to create a curved model for the data. 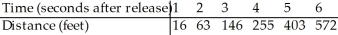
(Essay)
4.9/5  (38)
(38)
It's easy to measure the circumference of a tree's trunk,but not so easy to measure its height.Foresters developed a model for ponderosa pine trees that they use to predict the tree's height (h,in metres)from the circumference of its trunk (c,in centimetres): ln  = -1.2 + 1.4(ln c).A lumberjack finds a tree with a circumference of 30 cm.How tall does this model estimate the tree to be?
(Multiple Choice)
5.0/5 (36)
The relationship between two quantities x and y is examined,and the association is shown in the scatterplot below. 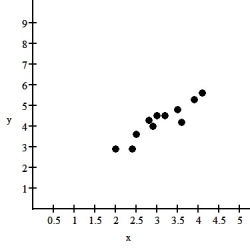 Describe the association between these variables shown in the scatterplot.
(Multiple Choice)
4.9/5 (38)
The relationship between two quantities x and y is examined.The relationship appears to be fairly linear.A linear model is considered,and the regression analysis is as follows:
Dependent variable: y
R-squared = 87.9%
VARIABLE COEFFICIENT
Intercept 37.74
X -9.97
What does the slope say about the relationship between x and y?
(Multiple Choice)
4.9/5 (31)
For the model  = 2.93(
  ),predict y when x = 2.Round to two decimal places.
(Multiple Choice)
4.9/5 (30)
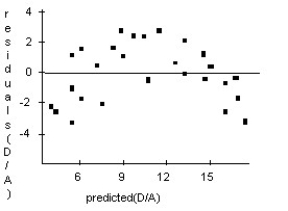
A forester would like to know how big a maple tree might be at age 50 years.She gathers data from some trees that have been cut down,and plots the diameters (in inches)of the trees against their ages (in years).First she makes a linear model.The scatterplot and residuals plot are shown.If she uses this model to try to predict the diameter of a 50-year old maple tree,would you expect that estimate to be fairly accurate,too low,or too high? Explain. 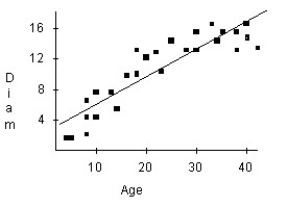
(Essay)
4.8/5 (35)
Doctors studying how the human body assimilates medication inject a patient with penicillin,and then monitor the concentration of the drug in the patient's blood for several hours.The data are shown in the table. 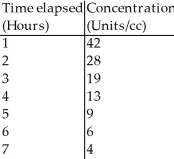 Straighten the scatterplot by re-expressing these data and create an appropriate model for predicting the concentration of penicillin.
(Essay)
4.9/5 (36)
A psychology graduate student is studying the effect of alcohol intoxication on a person's ability to perform manual tasks.In a very simple experiment,a subject's blood alcohol level is brought to a certain level and then the subject is presented with 10 rope knots.The subject then attempts to untie as many knots as he or she can in 30 seconds.The results of the experiments are summarized in the table below. 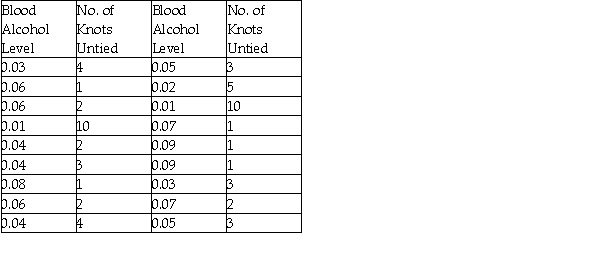 a)Re-express the number of knots untied by taking the inverse of each count,then plot the re-expressed data as a scatterplot.
 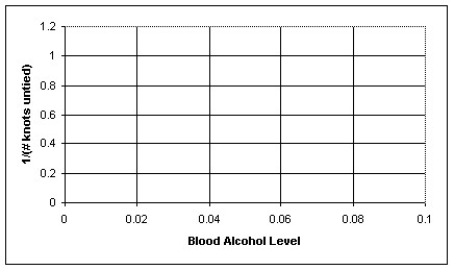 b)Determine the regression equation and correlation coefficient for the re-expressed data.
c)Interpret the y-intercept of your model.Does it have meaning?
b)Determine the regression equation and correlation coefficient for the re-expressed data.
c)Interpret the y-intercept of your model.Does it have meaning?
(Essay)
4.9/5 (39)
The model  = 12 + 20(dia)can be used to predict the breaking strength of a rope (in kilograms)from its diameter (in metres).According to this model,how much force should a rope one-half metre in diameter be able to withstand?
(Multiple Choice)
4.7/5 (32)
QuarkNet,a project funded by the National Science Foundation and the U.S.Department of Energy,poses the following problem on its website:
"Last year,deep within the Soudan mine,QuarkNet teachers began a long-term experiment to measure the amount of carbon-14 remaining in an initial 100-gram sample at 2000-year intervals.The experiment will be complete in the year 32001.Fortunately,a method for sending information backwards in time will be discovered in the year 29998,so,although the experiment is far from over,the results are in."
Here is a portion of the data:  A scatterplot of these data looks like:
 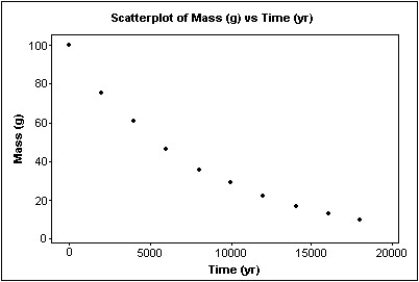 Can you use your model to predict when 50 g of the sample will be left? Explain.
(Essay)
4.8/5 (33)
Dioxins are a class of long-lived and highly toxic pollutants.The topsoil concentration in parts per million (ppm)are shown in the table below as a function of distance from the dump. 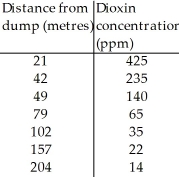 Create an appropriate model to re-express the Concentration (ppm).Then use your model to predict the dioxin concentration at a distance of 400 metres.Round all figures to 4 decimal places.
(Multiple Choice)
4.8/5 (35)
Filters
- Essay(0)
- Multiple Choice(0)
- Short Answer(0)
- True False(0)
- Matching(0)