Exam 23: Comparing Means
Exam 1: Data30 Questions
Exam 2: Displaying and Describing Categorical Data65 Questions
Exam 3: Displaying and Summarizing Quantitative Data93 Questions
Exam 4: Understanding and Comparing Distributions102 Questions
Exam 5: The Standard Deviation As a Ruler and the Normal Model131 Questions
Exam 6: Scatterplots, association, and Correlation74 Questions
Exam 7: Linear Regression57 Questions
Exam 8: Regression Wisdom32 Questions
Exam 9: Re-Expressing Data: Get It Straight51 Questions
Exam 10: Understanding Randomness26 Questions
Exam 11: Sample Surveys50 Questions
Exam 12: Experiments and Observational Surveys87 Questions
Exam 13: From Randomness to Probability64 Questions
Exam 14: Probability Rules90 Questions
Exam 15: Random Variables112 Questions
Exam 16: Probability Models114 Questions
Exam 17: Sampling Distribution Models45 Questions
Exam 18: Confidence Intervals for Proportions56 Questions
Exam 19: Testing Hypotheses About Proportions50 Questions
Exam 20: More About Tests69 Questions
Exam 21: Comparing Two Proportions52 Questions
Exam 22: Inferences About Means106 Questions
Exam 23: Comparing Means43 Questions
Exam 24: Paired Samples and Blocks33 Questions
Exam 25: Comparing Counts78 Questions
Exam 26: Inferences for Regression51 Questions
Exam 27: Analysis of Variance39 Questions
Exam 28: Multifactor Analysis of Variance22 Questions
Exam 29: Multiple Regression22 Questions
Exam 30: Multiple Regression Wisdom21 Questions
Exam 31: Rank-Based Nonparametric Tests29 Questions
Exam 32: The Bootstrap31 Questions
Select questions type
A researcher was interested in comparing the heights of women in two different countries.Independent random samples of 9 women from country A and 9 women from country B yielded the following heights (in centimetres). 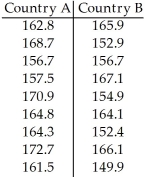 Determine a 90% confidence interval for the difference,
  -
-  ,between the mean height of women in Country A and the mean height of women in Country B.
(Multiple Choice)
4.8/5  (42)
(42)
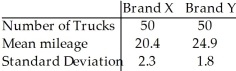
The table below gives information concerning the gasoline mileage for random samples of trucks of two different types.Find a 95% confidence interval for the difference in the means  -
-  .
. 
(Multiple Choice)
4.9/5 (37)
The owner of a large apartment complex had an in-ground swimming pool installed in an effort to increase tenant satisfaction.Nine tenants were randomly selected to complete a questionnaire that assessed their level of satisfaction with the apartment complex.Their scores before and after the installation of the pool are shown.The owner wants to assess the effectiveness of the pool in increasing tenant satisfaction. 
(Essay)
4.9/5 (44)
You wish to construct a 95% confidence interval to compare the mean measurement for two groups.A small pilot study yields sample standard deviations of 10 and 15 for Group 1 and Group 2,respectively.If we wish to obtain a margin of error of at most 5,what sample size should we take from each group? Assume equal sample sizes.
(Multiple Choice)
4.9/5 (28)
A grocery store is interested in determining whether or not a difference exists between the shelf life of Tasty Choice doughnuts and Sugar Twist doughnuts.A random sample of 100 boxes of each brand was selected and the mean shelf life in days was determined for each brand.A 98% confidence interval for the difference of the means,  -
-  ,was determined to be (1.1,2.8).
(Multiple Choice)
5.0/5 (41)
A researcher is interested in the academic performance differences between individuals using an optimistic versus a pessimistic approach to their studies.If the researcher claims a significant difference between groups,when in fact none exists:
(Multiple Choice)
4.9/5 (32)
A researcher wishes to determine whether people with high blood pressure can reduce their blood pressure by following a particular diet.Use the sample data below to test the claim that the treatment population mean μ1 is smaller than the control population mean μ2.Test the claim using a significance level of 0.01. 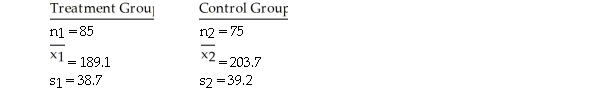
(Essay)
4.9/5 (41)
When testing for a difference between the means of a treated population and an untreated population,the computer display below is obtained.Explain what the P-value of 0.0768 means in this context. 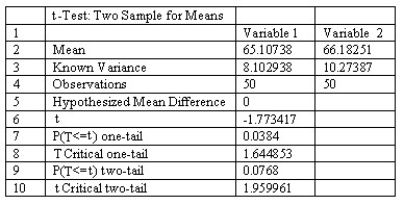
(Essay)
4.8/5 (36)
A researcher was interested in comparing the number of hours of television watched each day by two-year-olds and three-year-olds.A random sample of 18 two-year-olds and 18 three-year-olds yielded the follow data. 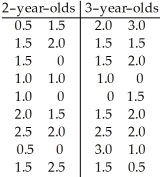 Find a 95% confidence interval for the difference,
  -
-  ,between the mean number of hours for two-year-olds and the mean number of hours for three-year-olds.
(Multiple Choice)
4.8/5 (42)
Compare the technique for decision making about populations using the hypothesis test method and the confidence interval method.
(Essay)
4.8/5 (39)
A study was made to determine which taxi company gave quicker service.Companies A and B were each called at 50 randomly selected times.The response times were recorded.The results are as follows.  At the 0.02 level of significance,test the claim that the two companies have different mean response times.
(Essay)
5.0/5 (44)
You wish to construct a 95% confidence interval to compare the mean measurement for two groups.A small pilot study yields sample standard deviations of 10 and 12 for Group 1 and Group 2,respectively.If we wish to obtain a margin of error of at most 2,what sample size should we take from each group? Assume equal sample sizes.
(Multiple Choice)
4.8/5 (33)
A grocery store manager is interested in determining whether or not a difference exists between the shelf life of two different brands of doughnuts.A random sample of 100 boxes of each brand was selected and the shelf life in days was determined for each box.The sample results are given below. 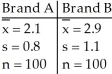 Find a 98% confidence interval for
  -
-  ,that is,the difference in mean shelf life between Brand A and Brand B.
(Multiple Choice)
4.7/5 (30)
A researcher wishes to determine whether people with high blood pressure can reduce their blood pressure by following a particular diet.Use the sample data below to construct a 99% confidence interval for  -
-  ,where y and y represent the population means for the treatment group and the control group,respectively.
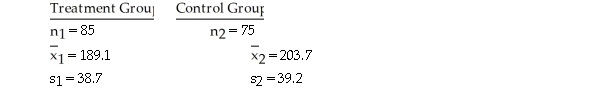
(Multiple Choice)
4.7/5 (33)
A researcher wishes to determine whether people with high blood pressure can reduce their blood pressure by following a particular diet.Subjects were randomly assigned to a treatment group and a control group.The mean blood pressure was determined for each group,and a 90% confidence interval for the difference in the mean between the treatment group and the control group,  -
-  ,was found to be (-26,-6).
(Multiple Choice)
4.7/5 (31)
A study was conducted to determine which taxi company gives quicker service.Companies A and B were each called at 50 randomly selected times.The response times were recorded.The results were as follows. 
(Essay)
4.8/5 (38)
A researcher is interested in the academic performance differences between individuals using an optimistic versus a pessimistic approach to their studies.If the researcher fails to find a significant difference,when in fact one exists in the population:
(Multiple Choice)
4.9/5 (30)
You wish to construct a 90% confidence interval to compare the mean measurement for two groups.A small pilot study yields sample standard deviations of 20 and 30 for Group 1 and Group 2,respectively.If we wish to obtain a margin of error of at most 5,what sample size should we take from each group? Assume equal sample sizes.
(Multiple Choice)
4.9/5 (34)
The Better Cookie Company claims its chocolate chip cookies have more chips than another chocolate chip cookie.120 Better Cookies and 100 of the other type of cookie were randomly selected and the number of chips in each cookie was recorded.The results are as follows.  At the 2% level of significance,test the claim that the population of Better Cookies has a higher mean number of chips.
(Essay)
4.9/5 (36)
Filters
- Essay(0)
- Multiple Choice(0)
- Short Answer(0)
- True False(0)
- Matching(0)