Exam 30: Multiple Regression Wisdom
Exam 1: Data30 Questions
Exam 2: Displaying and Describing Categorical Data65 Questions
Exam 3: Displaying and Summarizing Quantitative Data93 Questions
Exam 4: Understanding and Comparing Distributions102 Questions
Exam 5: The Standard Deviation As a Ruler and the Normal Model131 Questions
Exam 6: Scatterplots, association, and Correlation74 Questions
Exam 7: Linear Regression57 Questions
Exam 8: Regression Wisdom32 Questions
Exam 9: Re-Expressing Data: Get It Straight51 Questions
Exam 10: Understanding Randomness26 Questions
Exam 11: Sample Surveys50 Questions
Exam 12: Experiments and Observational Surveys87 Questions
Exam 13: From Randomness to Probability64 Questions
Exam 14: Probability Rules90 Questions
Exam 15: Random Variables112 Questions
Exam 16: Probability Models114 Questions
Exam 17: Sampling Distribution Models45 Questions
Exam 18: Confidence Intervals for Proportions56 Questions
Exam 19: Testing Hypotheses About Proportions50 Questions
Exam 20: More About Tests69 Questions
Exam 21: Comparing Two Proportions52 Questions
Exam 22: Inferences About Means106 Questions
Exam 23: Comparing Means43 Questions
Exam 24: Paired Samples and Blocks33 Questions
Exam 25: Comparing Counts78 Questions
Exam 26: Inferences for Regression51 Questions
Exam 27: Analysis of Variance39 Questions
Exam 28: Multifactor Analysis of Variance22 Questions
Exam 29: Multiple Regression22 Questions
Exam 30: Multiple Regression Wisdom21 Questions
Exam 31: Rank-Based Nonparametric Tests29 Questions
Exam 32: The Bootstrap31 Questions
Select questions type
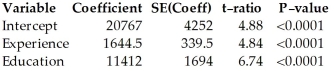
A company hired 25 employees for various positions.After the candidates were chosen,they wanted to see what the relationship of starting salary was based on years of experience and education level.They assign a 0,1,2,or 3 for high school diploma,bachelor's degree,master's degree,or a doctorate,respectively.The regression model looks like this:
Dependent variable is: Salary
R-squared = 69.6% R-squared (adjusted)= 66.9%
s = 7889 with 25 - 3 = 22 degrees of freedom 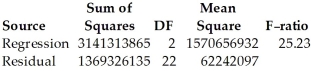
 -Here are histograms of the leverage and Studentized residuals for the regression model:
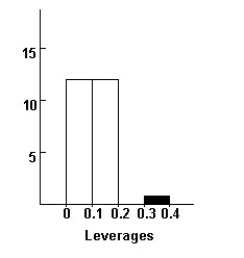
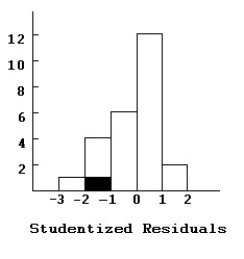 The 14th employee who was hired is highlighted in both displays.Do you think this employee is an influential case?
(Essay)
4.7/5  (24)
(24)
Filters
- Essay(0)
- Multiple Choice(0)
- Short Answer(0)
- True False(0)
- Matching(0)