Exam 2: Limits and Derivatives
Exam 1: Functions and Models118 Questions
Exam 2: Limits and Derivatives127 Questions
Exam 3: Differentiation Rules248 Questions
Exam 4: Applications of Differentiation273 Questions
Exam 5: Integrals239 Questions
Exam 6: Applications of Integration189 Questions
Exam 7: Differential Equations154 Questions
Exam 8: Infinite Sequences and Series341 Questions
Exam 9: Vectors and the Geometry of Space269 Questions
Exam 10: Vector Functions111 Questions
Exam 11: Partial Derivatives294 Questions
Exam 12: Multiple Integrals270 Questions
Exam 13: Vector Calculus240 Questions
Select questions type
Given the following information about limits, select a graph which could be the graph of y = f (x). f(x)=f(x)=-1f(x)=f(x)=\infty f(x)=f(x)=-\infty
(Multiple Choice)
4.9/5  (40)
(40)
Sketch the graph of a function f on [-5, 5] that satisfies all of the following conditions:
f (-4) = 2, f (-3) = -1, f(-2) = 2, f(1) = -3, f(2) = 1, f(3) = 0, f(4) = -3, , , and
(Essay)
4.7/5 (29)
The graph of f is given below. State, with reasons, the number(s) at which
(a) f is not differentiable. (b) f is not continuous. 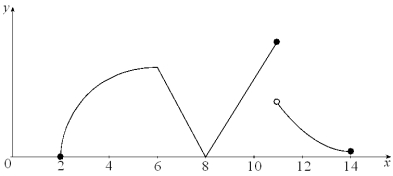
(Essay)
4.8/5 (39)
Given the graph of y = f (x) below, select a graph which best represents the graph of 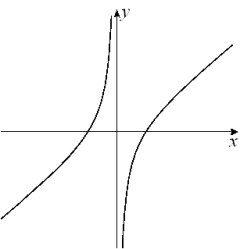
(Multiple Choice)
4.9/5 (44)
Use the graphs of f and g below to evaluate each limit, if it exists. If it does not exist, explain why. ![Use the graphs of f and g below to evaluate each limit, if it exists. If it does not exist, explain why. (a) \lim _ { x \rightarrow - 2 } [ f ( x ) + g ( x ) ] (b) \lim _ { x \rightarrow 2 } \left[ \frac { g ( x ) } { f ( x ) } \right] (c) \lim _ { x \rightarrow 1 } [ f ( x ) \cdot g ( x ) ] (d) \lim _ { x \rightarrow 0 } \left[ ( x - 3 ) ^ { 2 } \cdot g ( x ) \right]](https://storage.examlex.com/TB2033/11eaa8e2_0f4a_fff0_96ab_c14a68f4c95c_TB2033_00.jpg)
![Use the graphs of f and g below to evaluate each limit, if it exists. If it does not exist, explain why. (a) \lim _ { x \rightarrow - 2 } [ f ( x ) + g ( x ) ] (b) \lim _ { x \rightarrow 2 } \left[ \frac { g ( x ) } { f ( x ) } \right] (c) \lim _ { x \rightarrow 1 } [ f ( x ) \cdot g ( x ) ] (d) \lim _ { x \rightarrow 0 } \left[ ( x - 3 ) ^ { 2 } \cdot g ( x ) \right]](https://storage.examlex.com/TB2033/11eaa8e2_0f4a_fff1_96ab_d3739c20c852_TB2033_00.jpg) (a) (b) (c) (d)
(a) (b) (c) (d)
(Essay)
4.7/5 (38)
Determine whether each function is continuous or discontinuous. Explain your choice.(a) Postage charges to send a letter by first class mail.(b) The altitude of an airplane as a function of the time it has been in the air.(c) The temperature of an oven as it is run through its self cleaning cycle.(d) The number of people waiting in a queue for a bank teller.
(Essay)
4.7/5 (32)
Given the graph of below, select a graph which could be that of y = f (x). 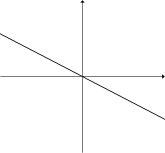
(Multiple Choice)
4.9/5 (36)
A projectile is launched vertically upward from the surface of Mars. The table below gives the height of the object at the indicated time following launch. Time (seconds): 0 0.4 0.8 1.2 1.6 2.0 2.4 2.8 3.2 3.6 Height (feet): 0 18.2 34.4 48.4 60.4 70.4 78.3 84.2 88.1 90.0 Time (seconds): 4.0 4.4 4.8 5.2 5.6 6.0 6.4 6.8 7.2 7.6 Height (feet): 89.6 87.3 82.9 76.5 68.1 57.6 45.1 30.5 13.8 0
(a) Graph the data.
(b) Using the data, compute the average velocity of the projectile on the following time intervals:
(i) [0; 4.0]
(ii) [0.8; 3.2]
(iii) [1.2; 2.8]
(iv) [1.6; 2.4]
(v) [2.0; 2.4]
(vi) [1.6; 2.0]
(c) Estimate the velocity of the projectile when t = 2.0. Justify your results.(d) Using your graph and the table of values, determine when the projectile reaches its maximum height. Justify your answer.(e) Using the graph and table of values, estimate the velocity of the projectile throughout the interval [0; 7.6] and sketch a graph of this velocity.
(Essay)
4.9/5 (39)
Given the graph of y = f (x), answer the following questions. 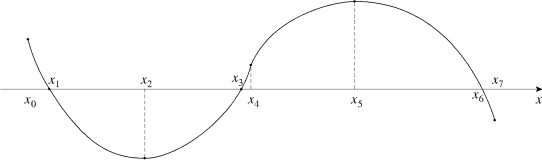 Find all values of x at which
(a) (b) (c) (d) f is increasing.(e) f is decreasing.(f) (g) (h) f has an inflection point.(i) (j)
Find all values of x at which
(a) (b) (c) (d) f is increasing.(e) f is decreasing.(f) (g) (h) f has an inflection point.(i) (j)
(Essay)
4.8/5 (32)
A tank is in the shape of a large, inverted (point-down) cone. Water is owing into the tank
at a constant rate. Let H (t) represent the height of the water level at time t.(a) Sketch a possible graph of H (t).(b) Describe how the rate of change of H with respect to t varies as t increases.(c) Sketch a graph of
(Essay)
4.8/5 (50)
Suppose that . f is not defined for .(a) For which of these two values does f have an infinite discontinuity? Explain.(b) For which of these two values does f have a removable discontinuity? Explain.
(Essay)
4.8/5 (32)
If f (1) = 5 and , find an equation of the tangent line at x = 1.
(Multiple Choice)
4.7/5 (39)
Given the graph of below, select a graph which could be that of y = f (x). 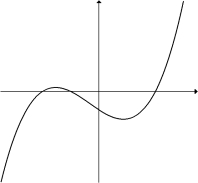
(Multiple Choice)
4.8/5 (33)
(a) Explain in your own words what is meant by (b) Is it possible for this statement to be true yet for f -(2) = 5? Explain.
(Essay)
4.8/5 (45)
A cellular phone company has a roaming charge of 32 cents for every minute or fraction of a minute when you are out of your zone.(a) Sketch a graph of the \out-of-your-zone" costs, C, of cellular phone usage as a function of the length of the call, t, for .(b) Evaluate:
(i) (ii) (c) Explain the significance of the left limit (i) and the right limit (ii) to the cell phone user.(d) For what values of t does C (t) not have a limit? Justify your answer.
(Essay)
4.8/5 (36)
Filters
- Essay(0)
- Multiple Choice(0)
- Short Answer(0)
- True False(0)
- Matching(0)