Exam 2: Limits and Derivatives
Exam 1: Functions and Models118 Questions
Exam 2: Limits and Derivatives127 Questions
Exam 3: Differentiation Rules248 Questions
Exam 4: Applications of Differentiation273 Questions
Exam 5: Integrals239 Questions
Exam 6: Applications of Integration189 Questions
Exam 7: Differential Equations154 Questions
Exam 8: Infinite Sequences and Series341 Questions
Exam 9: Vectors and the Geometry of Space269 Questions
Exam 10: Vector Functions111 Questions
Exam 11: Partial Derivatives294 Questions
Exam 12: Multiple Integrals270 Questions
Exam 13: Vector Calculus240 Questions
Select questions type
Use the Intermediate Value Theorem to show that x3 - 5x - 7 = 0 for some value of x in (2, 3).
(Essay)
4.8/5  (36)
(36)
Suppose that f (x) is defined on [1, 3] and that f (1) = 3 and f (3) = 5. Sketch a possible graph of f that does not satisfy the conclusion of the Intermediate Value Theorem.
(Essay)
4.9/5 (39)
Given the graph of , answer the questions that follow. 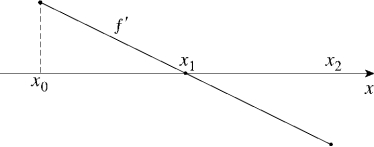 (a) Find all values of x at which
(i) f is increasing.(iv) (vii) (ii) f is decreasing.(v) (viii) f has a local maximum.(iii) (vi) (ix) f has a local minimum.(b) Sketch a graph which could represent y = f (x).
(a) Find all values of x at which
(i) f is increasing.(iv) (vii) (ii) f is decreasing.(v) (viii) f has a local maximum.(iii) (vi) (ix) f has a local minimum.(b) Sketch a graph which could represent y = f (x).
(Essay)
5.0/5 (31)
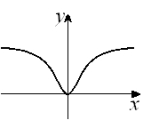
Given the graph of below, select a graph which could be that of y = f (x). 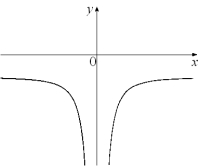
(Multiple Choice)
4.8/5 (31)
Let f (x) = . Find the following limits. Justify your answers.(a) (b) (c) (d) (e) (f)
(Essay)
4.8/5 (42)
Given the graph of f below, state the intervals on which f is continuous. 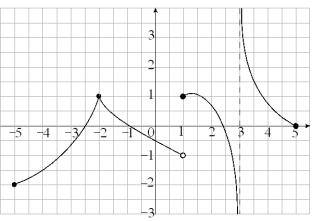
(Short Answer)
4.8/5 (37)
The following table shows the concentration (in mol/l) of a certain chemical in terms of reaction time (in hours) during a decomposition reaction. Time (hours) 0 5 10 20 30 50 Concentration (/) 2.32 1.86 1.49 0.98 0.62 0.25
(a) Find the average rate of change of concentration with respect to time for the following time intervals:
(i) [0; 5] (ii) [10; 20] (iii) [30; 50]
(b) Plot the points from the table and fit an appropriate exponential model to the data.(c) From your model in part (b), determine the instantaneous rate of change of concentration with respect to time.(d) Is the rate of change of concentration increasing or decreasing with respect to time? Justify your answer.
(Essay)
4.8/5 (42)
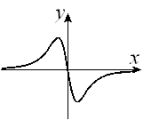
Given the graph of y = f (x) below, select a graph which best represents the graph of 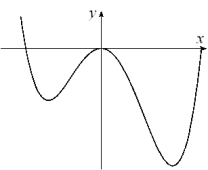 A)
A)
 B)
B)  C)
C)  D)
D)  E)
E)
 F)
F)
 G)
G)
 H)
H) 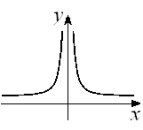
(Short Answer)
4.8/5 (47)
For the function f whose graph is given, arrange the following values in increasing order and explain your reasoning. 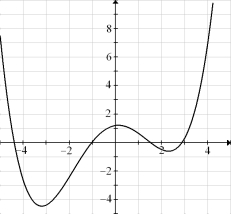
(Essay)
5.0/5 (32)
The graph of f is given below. State, with reasons, the number(s) at which
(a) f is not differentiable. (b) f is not continuous. 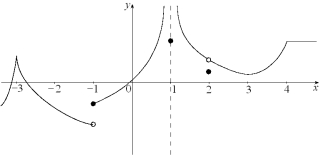
(Essay)
4.8/5 (27)
Month 1() 2() 3() 4() 5() 6() Temperature 6 14 26 43 57 66 Month 7() 8() 9() 10() 11() 12() Temperature 71 70 58 46 27 13
-During which of the following periods was the rate of change of the average daily temperature the smallest?
(Multiple Choice)
4.7/5 (33)
A car on a test track accelerates from 0 ft/s to 208 ft/s in 8 seconds. The car’s velocity is given in the table below:
t(s) 0 1 2 3 4 5 6 7 8 v(t)(ft/s) 0 18 47 77 104 132 163 184 208
-On what time interval does the car's average acceleration most closely approximate the average acceleration for the entire 8-second run?
(Multiple Choice)
4.8/5 (31)
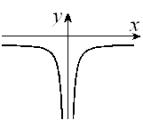
Find the value of x at which the curve has a vertical asymptote.
(Multiple Choice)
5.0/5 (38)
Given the graph of y = f (x) below, select a graph which best represents the graph of 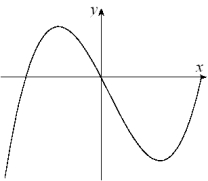
(Multiple Choice)
4.9/5 (50)
Filters
- Essay(0)
- Multiple Choice(0)
- Short Answer(0)
- True False(0)
- Matching(0)