Exam 13: Multiple Regression Analysis
Exam 1: Describing Data With Graphs134 Questions
Exam 2: Describing Data With Numerical Measures235 Questions
Exam 3: Describing Bivariate Data57 Questions
Exam 4: A: probability and Probability Distributions107 Questions
Exam 4: B: probability and Probability Distributions157 Questions
Exam 5: Several Useful Discrete Distributions166 Questions
Exam 6: The Normal Probability Distribution235 Questions
Exam 7: Sampling Distributions231 Questions
Exam 8: Large-Sample Estimation187 Questions
Exam 9: A: large-Sample Tests of Hypotheses154 Questions
Exam 9: B: large-Sample Tests of Hypotheses106 Questions
Exam 10: A: Inference From Small Samples192 Questions
Exam 10: B: Inference From Small Samples124 Questions
Exam 11: A: The Analysis of Variance136 Questions
Exam 11: B: The Analysis of Variance137 Questions
Exam 12: A: linear Regression and Correlation131 Questions
Exam 12: B: linear Regression and Correlation171 Questions
Exam 13: Multiple Regression Analysis232 Questions
Exam 14: Analysis of Categorical Data158 Questions
Exam 15: A:nonparametric Statistics139 Questions
Exam 15: B:nonparametric Statistics95 Questions
Select questions type
Quantitative predictor variables are entered into a regression model through indicator variables.
(True/False)
4.7/5  (22)
(22)
College Textbook Sales Narrative
A publisher of college textbooks conducted a study to relate profit per text y to cost of sales x over a six-year period when its sales force (and sales costs) were growing rapidly. These inflation-adjusted data (in thousands of dollars) were collected:  Expecting profit per book to rise and then plateau, the publisher fitted the model
  to the data.
-Refer to College Textbook Sales Narrative. Use statistical software to perform the multiple regression analysis for the model
to the data.
-Refer to College Textbook Sales Narrative. Use statistical software to perform the multiple regression analysis for the model 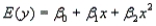 .
.
(Essay)
4.7/5 (33)
Typical symptoms of the presence of multicollinearity include which of the following?
(Multiple Choice)
4.8/5 (42)
Suppose you have a choice of three multiple linear regression models. Listed below are the independent variables (predictors) and the values of  and adjusted
  for each model.
 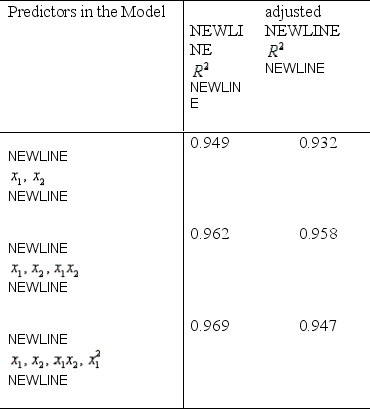 Which model would you choose as the most appropriate to use? Justify your answer.
(Essay)
4.9/5 (39)
In multiple regression analysis, which of the following is equal to the ratio MSR/MSE?
(Multiple Choice)
4.8/5 (44)
In a multiple regression model, the partial regression slope coefficients measure the average change in the dependent variable for a one-unit change in the dependent variable of interest, with all other independent variables held constant.
(True/False)
4.7/5 (30)
Multicollinearity is a condition that exists when the independent variables are highly correlated with the dependent variable.
(True/False)
4.7/5 (34)
Given a multiple regression with a regression sum of squares of 850 and a total sum of square of 1000, what is the coefficient of multiple determination?
(Multiple Choice)
4.7/5 (38)
College Textbook Sales Narrative
A publisher of college textbooks conducted a study to relate profit per text y to cost of sales x over a six-year period when its sales force (and sales costs) were growing rapidly. These inflation-adjusted data (in thousands of dollars) were collected: Expecting profit per book to rise and then plateau, the publisher fitted the model to the data.
-Refer to College Textbook Sales Narrative. Calculate  (adj). When would it be appropriate to use this value rather than
  to assess the fit of the model?
(Essay)
5.0/5 (31)
In multiple regression analysis, which procedure permits variables to enter and leave the model at different stages of its development?
(Multiple Choice)
4.9/5 (32)
In which of the following situations is stepwise regression especially useful?
(Multiple Choice)
4.8/5 (34)
Multicollinearity exists in virtually all multiple regression models.
(True/False)
4.8/5 (28)
Some statistical packages print a second  statistic, called the adjusted coefficient of determination, which has been adjusted for the degrees of freedom to take into account the sample size and the number of predictor variables.
(True/False)
4.8/5 (37)
In multiple regression analysis involving 10 independent variables and 100 observations, how many degrees of freedom will the critical value of t for testing individual coefficients in the model have?
(Multiple Choice)
4.7/5 (40)
Air Pollution Monitors Narrative
An experiment was designed to compare several different types of air pollution monitors. Each monitor was set up and then exposed to different concentrations of ozone, ranging between 15 and 230 parts per million (ppm), for periods of 8-72 hours. Filters on the monitor were then analyzed, and the response of the monitor was measured. The results for one type of monitor showed a linear pattern. The results for another type of monitor are listed in the table.  -Refer to Air Pollution Monitors Narrative. Use statistical software to fit the model from the previous question.
(Essay)
4.8/5 (32)
Life Expectancy Narrative
An actuary wanted to develop a model to predict how long individuals will live. After consulting a number of physicians, she collected the age at death (y), the average number of hours of exercise per week (  ), the cholesterol level (
  ), and the number of points that the individual's blood pressure exceeded the recommended value (
  ). A random sample of 40 individuals was selected. The computer output of the multiple regression model is shown below.
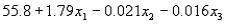
The regression equation is
). A random sample of 40 individuals was selected. The computer output of the multiple regression model is shown below.
The regression equation is 
 S = 9.47 R-Sq = 22.5%
Analysis of Variance
S = 9.47 R-Sq = 22.5%
Analysis of Variance  -Refer to Life Expectancy Narrative. Is there enough evidence at the 1% significance level to infer that the average number of hours of exercise per week and the age at death are linearly related? Justify your conclusion.
(Essay)
4.8/5 (34)
The coefficient of multiple determination takes on values between 0 and 1, inclusive.
(True/False)
4.9/5 (30)
A dummy or indicator variable is a dependent variable whose values are either 0.0 or 1.0.
(True/False)
4.9/5 (33)
The test statistic F found in the ANOVA table for testing the usefulness of the regression model is given by which of the following expressions?
(Multiple Choice)
4.9/5 (32)
Filters
- Essay(0)
- Multiple Choice(0)
- Short Answer(0)
- True False(0)
- Matching(0)