Exam 13: Multiple Regression Analysis
Exam 1: Describing Data With Graphs134 Questions
Exam 2: Describing Data With Numerical Measures235 Questions
Exam 3: Describing Bivariate Data57 Questions
Exam 4: A: probability and Probability Distributions107 Questions
Exam 4: B: probability and Probability Distributions157 Questions
Exam 5: Several Useful Discrete Distributions166 Questions
Exam 6: The Normal Probability Distribution235 Questions
Exam 7: Sampling Distributions231 Questions
Exam 8: Large-Sample Estimation187 Questions
Exam 9: A: large-Sample Tests of Hypotheses154 Questions
Exam 9: B: large-Sample Tests of Hypotheses106 Questions
Exam 10: A: Inference From Small Samples192 Questions
Exam 10: B: Inference From Small Samples124 Questions
Exam 11: A: The Analysis of Variance136 Questions
Exam 11: B: The Analysis of Variance137 Questions
Exam 12: A: linear Regression and Correlation131 Questions
Exam 12: B: linear Regression and Correlation171 Questions
Exam 13: Multiple Regression Analysis232 Questions
Exam 14: Analysis of Categorical Data158 Questions
Exam 15: A:nonparametric Statistics139 Questions
Exam 15: B:nonparametric Statistics95 Questions
Select questions type
In a regression setting, you should always select the model with the largest  .
.
(True/False)
4.9/5  (38)
(38)
Assume you are considering including two additional qualitative variables into a regression model. The first variable has four categories, and the second variable has four categories as well. Given this information, how many indicator variables will be incorporated into the model?
(Multiple Choice)
4.7/5 (26)
Under which of the following conditions does the of multicollinearity arise?
(Multiple Choice)
4.8/5 (39)
In multiple regression analysis, which of the following is a clue that multicollinearity is present?
(Multiple Choice)
4.8/5 (46)
The t distribution with df = n - 2 is used for testing a specific set of regression coefficients,e.g.,  .
.
(True/False)
4.8/5 (35)
For a multiple regression model, the following statistics are given: Total SS = 500, SSE = 60, and n = 20. In this case, what is the coefficient of determination, expressed as a percentage?
(Multiple Choice)
4.7/5 (27)
In reference to the equation 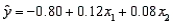 , the value -0.80 is the
  -intercept.
(True/False)
4.7/5 (31)
College Textbook Sales Narrative
A publisher of college textbooks conducted a study to relate profit per text y to cost of sales x over a six-year period when its sales force (and sales costs) were growing rapidly. These inflation-adjusted data (in thousands of dollars) were collected:  Expecting profit per book to rise and then plateau, the publisher fitted the model
 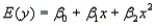 to the data.
-Refer to College Textbook Sales Narrative. Plot the data points. Does it look as though the quadratic model is necessary?
to the data.
-Refer to College Textbook Sales Narrative. Plot the data points. Does it look as though the quadratic model is necessary?
(Essay)
4.8/5 (30)
When two or more of the predictor variables are highly correlated with one another, adding or deleting a predictor variable may cause significant changes in the values of the other regression coefficients.
(True/False)
4.8/5 (24)
The  value will tend to be smaller than the adjusted
  value when insignificant independent variables are included in the model.
(True/False)
4.8/5 (33)
For a multiple regression model the following statistics are given: Total SS = 400, SSR = 350, k = 4, and n = 20. Given this information, what is the coefficient of determination adjusted for degrees of freedom?
(Multiple Choice)
4.9/5 (28)
The sequential sums of squares represent the conditional contribution of each of the predictor variables given the variables already in the model. Use the following partial output generated using MINITAB to determine which predictor variable accounts for the largest proportion of the total variation explained by the regression model. What is the proportion accounted by the selected variable? 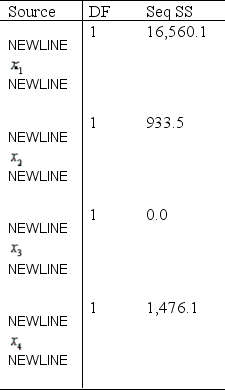
(Essay)
4.8/5 (34)
A multiple regression model has the form 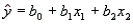 . The coefficient
  is interpreted as the change in
  per unit change in
  .
.
(True/False)
4.8/5 (32)
Chemical Comparisons Narrative
A chemist was interested in examining the effects of three chemicals on a chemical process yield. Let  , i = 1, 2, 3, represent the effects of the three chemicals, respectively, and y be the process yield. The following output was generated using statistical software.
Regression Analysis
, i = 1, 2, 3, represent the effects of the three chemicals, respectively, and y be the process yield. The following output was generated using statistical software.
Regression Analysis 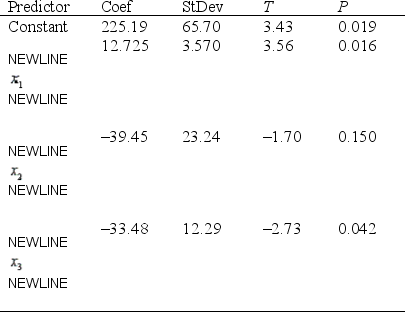 S = 14.01 R-Sq = 95.1% R-Sq(adj) = 92.1
Analysis of Variance
S = 14.01 R-Sq = 95.1% R-Sq(adj) = 92.1
Analysis of Variance  -Refer to Chemical Comparisons Narrative. Test the usefulness of the model at the 0.05 level of significance.
(Essay)
4.9/5 (25)
The coefficient of determination, R2, represents the proportion of the total variability in y that can be explained by the regression of y on x. When transformed to a percentage, it represents the percentage reduction in the sum of the squares of the error that can be accomplished by using the model to predict the dependent variable as opposed to just using the sample mean of the dependent variable.
(True/False)
4.8/5 (30)
In a multiple regression model involving 5 independent variables, if the sum of the squared residuals is 847 and the data set contains 40 points, then the value of the standard error of the estimate is 24.911.
(True/False)
4.9/5 (35)
A multiple regression model involves five independent variables and a sample of ten data points. If we want to test the validity of the model at the 5% significance level, what is the critical value?
(Multiple Choice)
4.9/5 (29)
Let ![Let be the least squares estimate of the population coefficient . If the regression assumptions hold true, the test statistic given by ] has an F distribution with and degrees of freedom, where n is the number of observations and is the number of predictor variables.](https://storage.examlex.com/TB4962/11eab386_b8c1_f56e_aec0_990781970fef_TB4962_11.jpg) be the least squares estimate of the population coefficient
be the least squares estimate of the population coefficient ![Let be the least squares estimate of the population coefficient . If the regression assumptions hold true, the test statistic given by ] has an F distribution with and degrees of freedom, where n is the number of observations and is the number of predictor variables.](https://storage.examlex.com/TB4962/11eab386_b8c1_f56f_aec0_e1d06e7dae3e_TB4962_11.jpg) . If the regression assumptions hold true, the test statistic given by
. If the regression assumptions hold true, the test statistic given by ![Let be the least squares estimate of the population coefficient . If the regression assumptions hold true, the test statistic given by ] has an F distribution with and degrees of freedom, where n is the number of observations and is the number of predictor variables.](https://storage.examlex.com/TB4962/11eab386_b8c1_f570_aec0_ff6b7f2d12d2_TB4962_11.jpg) ] has an F distribution with
] has an F distribution with ![Let be the least squares estimate of the population coefficient . If the regression assumptions hold true, the test statistic given by ] has an F distribution with and degrees of freedom, where n is the number of observations and is the number of predictor variables.](https://storage.examlex.com/TB4962/11eab386_b8c1_f571_aec0_8b535094ed72_TB4962_11.jpg) and
and ![Let be the least squares estimate of the population coefficient . If the regression assumptions hold true, the test statistic given by ] has an F distribution with and degrees of freedom, where n is the number of observations and is the number of predictor variables.](https://storage.examlex.com/TB4962/11eab386_b8c1_f572_aec0_9b16592de604_TB4962_11.jpg) degrees of freedom, where n is the number of observations and
degrees of freedom, where n is the number of observations and ![Let be the least squares estimate of the population coefficient . If the regression assumptions hold true, the test statistic given by ] has an F distribution with and degrees of freedom, where n is the number of observations and is the number of predictor variables.](https://storage.examlex.com/TB4962/11eab386_b8c1_f573_aec0_ddbfdf624c1d_TB4962_11.jpg) is the number of predictor variables.
is the number of predictor variables.
(True/False)
5.0/5 (45)
In a multiple regression analysis involving 4 predictor variables and 25 observations, the total sum of squares is 800, and the error sum of squares is 200. What, then, is the value of the F-test statistic for testing the usefulness of this model?
(Multiple Choice)
4.7/5 (35)
In testing the validity of a multiple regression model involving 10 independent variables and 100 observations, what will the respective values of the numerator and denominator degrees of freedom for the critical value of F be?
(Multiple Choice)
4.8/5 (35)
Filters
- Essay(0)
- Multiple Choice(0)
- Short Answer(0)
- True False(0)
- Matching(0)