Exam 13: Multiple Regression Analysis
Exam 1: Describing Data With Graphs134 Questions
Exam 2: Describing Data With Numerical Measures235 Questions
Exam 3: Describing Bivariate Data57 Questions
Exam 4: A: probability and Probability Distributions107 Questions
Exam 4: B: probability and Probability Distributions157 Questions
Exam 5: Several Useful Discrete Distributions166 Questions
Exam 6: The Normal Probability Distribution235 Questions
Exam 7: Sampling Distributions231 Questions
Exam 8: Large-Sample Estimation187 Questions
Exam 9: A: large-Sample Tests of Hypotheses154 Questions
Exam 9: B: large-Sample Tests of Hypotheses106 Questions
Exam 10: A: Inference From Small Samples192 Questions
Exam 10: B: Inference From Small Samples124 Questions
Exam 11: A: The Analysis of Variance136 Questions
Exam 11: B: The Analysis of Variance137 Questions
Exam 12: A: linear Regression and Correlation131 Questions
Exam 12: B: linear Regression and Correlation171 Questions
Exam 13: Multiple Regression Analysis232 Questions
Exam 14: Analysis of Categorical Data158 Questions
Exam 15: A:nonparametric Statistics139 Questions
Exam 15: B:nonparametric Statistics95 Questions
Select questions type
In reference to the equation  , the value -0.75 is the intercept.
(True/False)
4.8/5  (35)
(35)
In a multiple linear regression model,  ,
,  is the intercept, while
  are the partial slopes, or partial regression coefficients.
(True/False)
4.7/5 (32)
A regression model of the form  is called a third-order polynomial model.
(True/False)
4.8/5 (32)
Given MSR = 345 and MSE = 431.25, what is the value of the F statistic?
(Multiple Choice)
4.8/5 (37)
Multicollinearity is a situation in which two or more of the independent variables are highly correlated with each other.
(True/False)
4.7/5 (36)
Life Expectancy Narrative
An actuary wanted to develop a model to predict how long individuals will live. After consulting a number of physicians, she collected the age at death (y), the average number of hours of exercise per week (  ), the cholesterol level (
  ), and the number of points that the individual's blood pressure exceeded the recommended value (
  ). A random sample of 40 individuals was selected. The computer output of the multiple regression model is shown below.
The regression equation is
). A random sample of 40 individuals was selected. The computer output of the multiple regression model is shown below.
The regression equation is 
 S = 9.47 R-Sq = 22.5%
Analysis of Variance
S = 9.47 R-Sq = 22.5%
Analysis of Variance  -Refer to Life Expectancy Narrative. Is there enough evidence at the 10% significance level to infer that the model is useful in predicting length of life?
(Essay)
4.9/5 (35)
Which of the following correctly describes a multiple-regression ANOVA test?
(Multiple Choice)
4.9/5 (37)
What is the range in values of the coefficient of multiple determination?
(Multiple Choice)
4.8/5 (43)
A coefficient of multiple correlation, denoted by R, equals the proportion of the total variation in the values of the dependent variable, Y, that is explained by the estimated multiple regression of Y on  and possibly additional independent variables (
  and so on).
(True/False)
4.9/5 (35)
In multiple regression models, which of the following may be assumed in with respect to the values of the error variable  ?
?
(Multiple Choice)
4.8/5 (49)
A multiple regression analysis involving 3 independent variables and 25 data points results in a value of 0.769 for the unadjusted multiple coefficient of determination. What is the adjusted multiple coefficient of determination?
(Multiple Choice)
4.8/5 (40)
In a multiple regression analysis involving six independent variables, the sum of squares are calculated as: Total SS = 900, SSR = 600, and SSE = 300. In this case, the value of the F-test statistic is 150.
(True/False)
4.8/5 (43)
Demographic Variables and TV Narrative
A statistician wanted to determine if the demographic variables of age, education, and income influence the number of hours of television watched per week. A random sample of 25 adults was selected to estimate the multiple regression model: 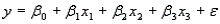 , where y is the number of hours of television watched last week,
  is the age (in years),
  is the number of years of education, and
  is income (in $1000s). The computer output is shown below.
The regression equation is
is income (in $1000s). The computer output is shown below.
The regression equation is 
 S = 4.51 R-Sq = 34.8%
Analysis of Variance
S = 4.51 R-Sq = 34.8%
Analysis of Variance  -Refer to Demographic Variables and TV Narrative. Interpret the coefficient
  .
.
(Essay)
4.8/5 (36)
A multiple regression equation includes five independent variables, and the coefficient of determination is 0.81. The percentage of the variation in  that is explained by the regression equation is 90%.
(True/False)
4.9/5 (37)
Demographic Variables and TV Narrative
A statistician wanted to determine if the demographic variables of age, education, and income influence the number of hours of television watched per week. A random sample of 25 adults was selected to estimate the multiple regression model: , where y is the number of hours of television watched last week, is the age (in years), is the number of years of education, and is income (in $1000s). The computer output is shown below.
The regression equation is S = 4.51 R-Sq = 34.8%
Analysis of Variance
-Refer to Demographic Variables and TV Narrative. Interpret the coefficient  .
.
(Essay)
4.7/5 (30)
Consider a multiple regression model with three independent variables. If the y-intercept is negative, then at least two of the partial regression slope coefficients will also be negative.
(True/False)
4.9/5 (36)
It is appropriate to compute a correlation coefficient for the relationship between a dummy variable and a dependent variable.
(True/False)
4.7/5 (34)
A regression model of the form 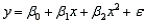 is called a quadratic model or a second-order polynomial model.
(True/False)
4.8/5 (36)
Rocket Experiments Narrative
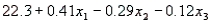
An engineer was investigating the relationship between the thrust of an experimental rocket (y), the percent composition of a secret chemical in the fuel (x1), and the internal temperature of a chamber of the rocket (x2). The engineer starts by fitting a quadratic model, but he believes that the full quadratic model is too complex and can be reduced by including only the linear terms and the interaction term.
-Refer to Rocket Experiments Narrative. Write the two models the engineer is considering.
(Essay)
4.8/5 (23)
In a multiple linear regression model, 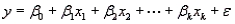 ,
,  are independent predictor variables that are measured without error.
(True/False)
4.7/5 (32)
Filters
- Essay(0)
- Multiple Choice(0)
- Short Answer(0)
- True False(0)
- Matching(0)