Exam 13: Multiple Regression Analysis
Exam 1: Describing Data With Graphs134 Questions
Exam 2: Describing Data With Numerical Measures235 Questions
Exam 3: Describing Bivariate Data57 Questions
Exam 4: A: probability and Probability Distributions107 Questions
Exam 4: B: probability and Probability Distributions157 Questions
Exam 5: Several Useful Discrete Distributions166 Questions
Exam 6: The Normal Probability Distribution235 Questions
Exam 7: Sampling Distributions231 Questions
Exam 8: Large-Sample Estimation187 Questions
Exam 9: A: large-Sample Tests of Hypotheses154 Questions
Exam 9: B: large-Sample Tests of Hypotheses106 Questions
Exam 10: A: Inference From Small Samples192 Questions
Exam 10: B: Inference From Small Samples124 Questions
Exam 11: A: The Analysis of Variance136 Questions
Exam 11: B: The Analysis of Variance137 Questions
Exam 12: A: linear Regression and Correlation131 Questions
Exam 12: B: linear Regression and Correlation171 Questions
Exam 13: Multiple Regression Analysis232 Questions
Exam 14: Analysis of Categorical Data158 Questions
Exam 15: A:nonparametric Statistics139 Questions
Exam 15: B:nonparametric Statistics95 Questions
Select questions type
Including a dummy variable into a regression model will simplify the regression results and help people to interpret the meaning of the regression parameters.
(True/False)
4.9/5  (38)
(38)
In a multiple regression model, the coefficient of determination will be equal to the square of the largest correlation value between the dependent variable and the independent variables.
(True/False)
4.9/5 (38)
In a multiple linear regression model, 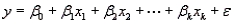 , the coefficient
  measures the change in the dependent variable y for a unit change in
  when all other independent variables are held constant.
(True/False)
4.9/5 (28)
Rocket Experiments Narrative
An engineer was investigating the relationship between the thrust of an experimental rocket (y), the percent composition of a secret chemical in the fuel (x1), and the internal temperature of a chamber of the rocket (x2). The engineer starts by fitting a quadratic model, but he believes that the full quadratic model is too complex and can be reduced by including only the linear terms and the interaction term.
-Refer to Chemical Analysis Narrative. Write the two models the chemist considered.
(Essay)
4.8/5 (33)
Fuel Consumption and Horsepower
An automobile manufacturer would like to know the fuel consumption (y, in litres per 100 km) of a car based on four predictor variables:  = horsepower,
  = torque,
  = displacement (litres), and
  = weight (kg). Suppose the following equation does indeed describe the true relationship:
  -Refer to Fuel Consumption and Horsepower. What is the gas mileage for a car with 210 horsepower, 330 torque, 7 L of displacement, and weight 2600 kg?
(Short Answer)
4.8/5 (34)
In a regression setting, you should select a model where all the regression coefficients have p-values greater than 0.05.
(True/False)
4.9/5 (42)
If you wish to develop a multiple regression model that includes a qualitative variable, for example, education status, in which the following categories exist: no degree, high school diploma, college degree, bachelor degree, and graduate degree, you need to code the categories as 1, 2, 3, 4, and 5.
(True/False)
4.9/5 (38)
Personal Spending and Personal Income
Is personal spending linearly related to orders for durable goods and personal income? A recent study reported the amounts of personal spending (in trillions of dollars), amount spent on durable goods (in billions of dollars), and personal income (in trillions of dollars). A statistical package was used to fit a linear regression model, producing the output below. 
 R2 = 95.9% R2(adj) = 95.0%, s = 0.0144 with 12 - 3 = 9 df.
-Refer to Personal Spending and Personal Income. Based on your confidence intervals in above, does personal income have any predictive power beyond that provided by the other independent variables for determining personal spending? Explain.
R2 = 95.9% R2(adj) = 95.0%, s = 0.0144 with 12 - 3 = 9 df.
-Refer to Personal Spending and Personal Income. Based on your confidence intervals in above, does personal income have any predictive power beyond that provided by the other independent variables for determining personal spending? Explain.
(Essay)
4.8/5 (36)
If a qualitative variable has m categories, you should use m - 1 dummy variables to incorporate the qualitative variable into a regression model.
(True/False)
4.8/5 (40)
A multiple regression model involves 40 observations and 4 independent variables and produces SST = 2000 and SSR = 1608. The value of MSE is 11.2.
(True/False)
4.8/5 (37)
In reference to the equation 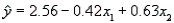 , the value 0.63 is the average change in
  per unit change in
  , regardless of the value of
  .
.
(True/False)
4.8/5 (30)
In a multiple regression model, if there are ten independent variables included in the model, then the sample size should be at least ten.
(True/False)
5.0/5 (34)
In a multiple regression analysis involving 24 data points, the mean squares for error, MSE, is 2, and the sum of squares for error, SSE, is 36. Under these circumstances, what must the number of the predictor variables be?
(Multiple Choice)
4.7/5 (29)
A multiple regression model has the form 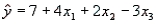 . As
. As  increases by 1 unit, with
  and
and  held constant, what is expected to happen to y on average?
(Multiple Choice)
4.8/5 (38)
To test the validity of a multiple regression model involving two independent variables, which of the following is the most appropriate null hypothesis?
(Multiple Choice)
4.9/5 (36)
The more predictors that are added to a regression model, the larger the coefficient of determination R2 value will be.
(True/False)
4.8/5 (37)
The first-order model 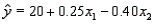 attempts to explain average air temperatures in degrees Celsius for a particular day as a function of distance from the coast (
  , in km) and altitude (
  , in hundreds of metres). Interpret the parameters
  .
.
(Essay)
4.8/5 (34)
Personal Spending and Personal Income
Is personal spending linearly related to orders for durable goods and personal income? A recent study reported the amounts of personal spending (in trillions of dollars), amount spent on durable goods (in billions of dollars), and personal income (in trillions of dollars). A statistical package was used to fit a linear regression model, producing the output below. R2 = 95.9% R2(adj) = 95.0%, s = 0.0144 with 12 - 3 = 9 df.
-Refer to Personal Spending and Personal Income. Write the model that was fit. Include the estimates of the parameters.
(Essay)
4.9/5 (34)
Electric Usage Narrative
The power company claims the amount of electricity used by a house (y) depends on  = square metres of heated space,
  = mean outside temperature, and
  = mean hours of sunlight per day. Partial statistical software output is given below.
Regression Analysis
The regression equation is = 357 + 0.808
= mean hours of sunlight per day. Partial statistical software output is given below.
Regression Analysis
The regression equation is = 357 + 0.808  - 16.6
  + 40
+ 40 
 S = 267.7 R-sq = 82.0% R-sq(adj) = 76.6%
Analysis of Variance
S = 267.7 R-sq = 82.0% R-sq(adj) = 76.6%
Analysis of Variance  -Refer to Electric Usage Narrative. Obtain a point prediction of the electricity use for a home that has 300 m2 of space, an outside temperature of 3°C, and 10.2 hours of sunlight.
(Essay)
4.9/5 (20)
Filters
- Essay(0)
- Multiple Choice(0)
- Short Answer(0)
- True False(0)
- Matching(0)