Exam 13: Multiple Regression Analysis
Exam 1: Describing Data With Graphs134 Questions
Exam 2: Describing Data With Numerical Measures235 Questions
Exam 3: Describing Bivariate Data57 Questions
Exam 4: A: probability and Probability Distributions107 Questions
Exam 4: B: probability and Probability Distributions157 Questions
Exam 5: Several Useful Discrete Distributions166 Questions
Exam 6: The Normal Probability Distribution235 Questions
Exam 7: Sampling Distributions231 Questions
Exam 8: Large-Sample Estimation187 Questions
Exam 9: A: large-Sample Tests of Hypotheses154 Questions
Exam 9: B: large-Sample Tests of Hypotheses106 Questions
Exam 10: A: Inference From Small Samples192 Questions
Exam 10: B: Inference From Small Samples124 Questions
Exam 11: A: The Analysis of Variance136 Questions
Exam 11: B: The Analysis of Variance137 Questions
Exam 12: A: linear Regression and Correlation131 Questions
Exam 12: B: linear Regression and Correlation171 Questions
Exam 13: Multiple Regression Analysis232 Questions
Exam 14: Analysis of Categorical Data158 Questions
Exam 15: A:nonparametric Statistics139 Questions
Exam 15: B:nonparametric Statistics95 Questions
Select questions type
If the confidence interval estimate for the regression slope coefficient, based on the sample information, crosses over 0, then the true population regression slope coefficient could be 0.
(True/False)
4.9/5  (37)
(37)
Multiple correlation analysis measures the overall strength of association among more than two variables.
(True/False)
4.7/5 (35)
If the  value for a multiple regression model with two independent variables is 0.81, then the correlation between the two independent variables will be 0.90.
(True/False)
4.9/5 (27)
In a multiple regression model, the regression coefficients are calculated such that the quantity  is minimized.
(True/False)
4.8/5 (43)
How many dummy variables will you need to include if you wish to develop a regression model in which the high school class standing is a qualitative variable with four possible levels of response?
(Multiple Choice)
4.9/5 (38)
Demographic Variables and TV Narrative
A statistician wanted to determine if the demographic variables of age, education, and income influence the number of hours of television watched per week. A random sample of 25 adults was selected to estimate the multiple regression model: 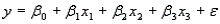 , where y is the number of hours of television watched last week,
  is the age (in years),
  is the number of years of education, and
  is income (in $1000s). The computer output is shown below.
The regression equation is
is income (in $1000s). The computer output is shown below.
The regression equation is 
 S = 4.51 R-Sq = 34.8%
Analysis of Variance
S = 4.51 R-Sq = 34.8%
Analysis of Variance  -Refer to Eating Habits of Canadians. Use the printout to find a 95% confidence interval for the average beef consumption per family of three in 2005. What is the 95% prediction interval for the beef consumption per family of three in 2005? Is there any with the validity of the 95% confidence level for these intervals?
(Essay)
4.9/5 (28)
The adjusted multiple coefficient of determination is adjusted for which of the following quantities?
(Multiple Choice)
4.7/5 (16)
Fuel Consumption and Horsepower
An automobile manufacturer would like to know the fuel consumption (y, in litres per 100 km) of a car based on four predictor variables:  = horsepower,
  = torque,
  = displacement (litres), and
  = weight (kg). Suppose the following equation does indeed describe the true relationship:
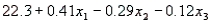
  -Refer to Fuel Consumption and Horsepower. How would you interpret the values of
  ?
?
(Essay)
5.0/5 (39)
Three qualitative variables need to be incorporated into a regression model. The first variable has five possible categories, the second one has three possible categories, and the third one has two possible categories. Based on this information, ten dummy variables need to be included in the regression model.
(True/False)
4.8/5 (25)
A multiple regression model has the form  . Which of the following is the best interpretation of the coefficient
  ?
?
(Multiple Choice)
4.8/5 (30)
In general, on what basis are independent variables selected for entry into the equation during stepwise regression?
(Essay)
4.9/5 (26)
Multicollinearity is present if the dependent variable is linearly related to one of the explanatory variables.
(True/False)
4.7/5 (40)
Demographic Variables and TV Narrative
A statistician wanted to determine if the demographic variables of age, education, and income influence the number of hours of television watched per week. A random sample of 25 adults was selected to estimate the multiple regression model: , where y is the number of hours of television watched last week, is the age (in years), is the number of years of education, and is income (in $1000s). The computer output is shown below.
The regression equation is S = 4.51 R-Sq = 34.8%
Analysis of Variance
-Refer to Demographic Variables and TV Narrative. What is the coefficient of determination? What does this statistic tell you?
(Essay)
4.8/5 (33)
College Textbook Sales Narrative
A publisher of college textbooks conducted a study to relate profit per text y to cost of sales x over a six-year period when its sales force (and sales costs) were growing rapidly. These inflation-adjusted data (in thousands of dollars) were collected:  Expecting profit per book to rise and then plateau, the publisher fitted the model
  to the data.
-Refer to College Textbook Sales Narrative. Do the data indicate a significant curvature in the relationship between y and x? Test at the 5% level of significance.
to the data.
-Refer to College Textbook Sales Narrative. Do the data indicate a significant curvature in the relationship between y and x? Test at the 5% level of significance.
(Essay)
4.8/5 (31)
Stepwise regression is a statistical technique that is always implemented when developing a regression model to fit a nonlinear relationship between the dependent and potential independent variables.
(True/False)
4.7/5 (29)
College Textbook Sales Narrative
A publisher of college textbooks conducted a study to relate profit per text y to cost of sales x over a six-year period when its sales force (and sales costs) were growing rapidly. These inflation-adjusted data (in thousands of dollars) were collected: Expecting profit per book to rise and then plateau, the publisher fitted the model to the data.
-Refer to College Textbook Sales Narrative. The value  (adj) was 95.7% when a simple linear model was fit to the data. Does the linear or the quadratic model fit better?
(Essay)
4.9/5 (37)
Magazine Sales Narrative
A publisher is studying the effectiveness of advertising to sell a woman's magazine. She wishes to investigate the relationship between the number of magazines sold (10,000s), the "reach" (proportion of the population who see at least one advertisement for the magazine), and the average income of the target market ($1000s). The publisher suspects people at certain income levels might be more susceptible to this advertising campaign than others. Preliminary studies show there is no evidence of a quadratic relationship between sales and either of the other two variables. Use the output below to answer the questions.
The regression equation is
Sales = 3.1 + 10341 Reach + 0.871 Income + 3.256 Reach*Income  S = 8.43 R-sq = 82.4%
Analysis of Variance
S = 8.43 R-sq = 82.4%
Analysis of Variance  -Refer to Magazine Sales Narrative. Develop 95% confidence intervals for the intercept and the partial regression coefficients.
(Essay)
4.7/5 (27)
Fuel Consumption and Horsepower
An automobile manufacturer would like to know the fuel consumption (y, in litres per 100 km) of a car based on four predictor variables: = horsepower, = torque, = displacement (litres), and = weight (kg). Suppose the following equation does indeed describe the true relationship:
-Refer to Fuel Consumption and Horsepower. What is the gas mileage for a car with horsepower 160, torque 250, displacement 1.9 L (1900 cm3), and weight 2000 kg?
(Short Answer)
4.8/5 (40)
If a stepwise regression procedure is used to enter, one at a time, three variables into a regression model, the resulting regression equation may differ from the regression equation that occurs when all three variables are entered at one step.
(True/False)
4.8/5 (33)
Filters
- Essay(0)
- Multiple Choice(0)
- Short Answer(0)
- True False(0)
- Matching(0)