Exam 20: Statistical Process Control
Exam 1: Operations and Productivity126 Questions
Exam 2: Operations Strategy in a Global Environment119 Questions
Exam 3: Project Management120 Questions
Exam 4: Forecasting141 Questions
Exam 5: Design of Goods and Services118 Questions
Exam 6: Managing Quality123 Questions
Exam 7: Process Strategy108 Questions
Exam 8: Capacity and Constraint Management96 Questions
Exam 9: Location Strategies120 Questions
Exam 10: Layout Strategies146 Questions
Exam 11: Human Resources, job Design, and Work Measurement154 Questions
Exam 12: Supply Chain Management144 Questions
Exam 13: Inventory Management163 Questions
Exam 14: Aggregate Planning and Sop116 Questions
Exam 15: Material Requirements Planning Mrpand Erp113 Questions
Exam 16: Short-Term Scheduling116 Questions
Exam 17: Jit, tps, and Lean Operations115 Questions
Exam 18: Maintenance and Reliability111 Questions
Exam 19: Sustainability in the Supply Chain80 Questions
Exam 20: Statistical Process Control144 Questions
Exam 21: Supply Chain Management Analytics55 Questions
Exam 22: Decision-Making Tools97 Questions
Exam 23: Linear Programming80 Questions
Exam 24: Transportation Models89 Questions
Exam 25: Waiting-Line Models119 Questions
Exam 26: Learning Curves105 Questions
Exam 27: Simulation75 Questions
Select questions type
The higher the process capability ratio,the greater the likelihood that process will be within design specifications.
Free
(True/False)
4.7/5  (31)
(31)
Correct Answer: Verified
True
An acceptance sampling plan's ability to discriminate between low quality lots and high quality lots is described by:
Free
(Multiple Choice)
4.8/5 (37)
Correct Answer:Verified
D
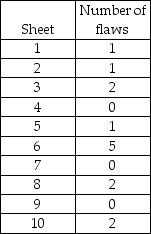
McDaniel Shipyards wants to develop a control chart to assess the quality of its steel plate.They take ten sheets of 1" steel plate and compute the number of cosmetic flaws on each roll.Each sheet is 20' by 100'.Based on the following data,develop limits for the 3-sigma control chart,plot the control chart,and determine whether the process is in control.
Free
(Essay)
4.9/5 (30)
Correct Answer:Verified
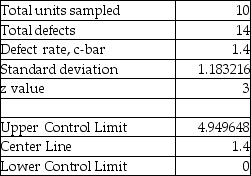
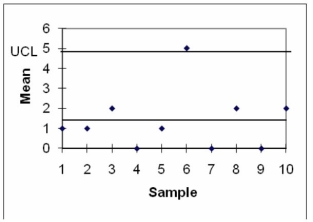 Sample six is above the control limits; therefore,the process is out of control.
The steeper an OC curve,the better it discriminates between good and bad lots.
(True/False)
4.8/5 (38)
________ is variation in a production process that can be traced to specific causes.
(Short Answer)
4.9/5 (28)
When a lot has been accepted by acceptance sampling,we know that:
(Multiple Choice)
4.7/5 (38)
Jars of pickles are sampled and weighed.Sample measures are plotted on control charts.The ideal weight should be precisely 11 oz.Which type of chart(s)would you recommend?
(Multiple Choice)
4.7/5 (38)
The specification for a plastic handle calls for a length of 6.0 inches ± .2 inches.The standard deviation of the process is estimated to be 0.05 inches.What are the upper and lower specification limits for this product? The process is known to operate at a mean thickness of 6.1 inches.What are the Cp and Cpk values for this process? Is this process capable of producing the desired part?
(Essay)
4.8/5 (37)
The usual purpose of an R-chart is to signal whether there has been a:
(Multiple Choice)
4.9/5 (32)
Red Top Cab Company receives multiple complaints per day about driver behavior.Over 9 days the owner recorded the number of calls to be 3,0,8,9,6,7,4,9,and 8.What is the upper control limit for the 3-sigma c-chart?
(Multiple Choice)
4.8/5 (37)
A Cpk index greater than ________ is a capable process,one that generates fewer than 2.7 defects per 1000 at the ±3σ level.
(Short Answer)
4.8/5 (27)
A lot that is accepted by acceptance sampling is certified to be free of defects.
(True/False)
4.7/5 (41)
The upper and lower limits for diving ring diameters made by John's Swimming Co.are 40 and 39 cm.,respectively.John took 11 samples with the following average diameters (39,39.1,39.2,39.3,39.4,39.5 39.6,39.7,39.8,39.9,40).Is the process in control?
(Multiple Choice)
4.9/5 (30)
Filters
- Essay(0)
- Multiple Choice(0)
- Short Answer(0)
- True False(0)
- Matching(0)