Exam 20: Statistical Process Control
Exam 1: Operations and Productivity126 Questions
Exam 2: Operations Strategy in a Global Environment119 Questions
Exam 3: Project Management120 Questions
Exam 4: Forecasting141 Questions
Exam 5: Design of Goods and Services118 Questions
Exam 6: Managing Quality123 Questions
Exam 7: Process Strategy108 Questions
Exam 8: Capacity and Constraint Management96 Questions
Exam 9: Location Strategies120 Questions
Exam 10: Layout Strategies146 Questions
Exam 11: Human Resources, job Design, and Work Measurement154 Questions
Exam 12: Supply Chain Management144 Questions
Exam 13: Inventory Management163 Questions
Exam 14: Aggregate Planning and Sop116 Questions
Exam 15: Material Requirements Planning Mrpand Erp113 Questions
Exam 16: Short-Term Scheduling116 Questions
Exam 17: Jit, tps, and Lean Operations115 Questions
Exam 18: Maintenance and Reliability111 Questions
Exam 19: Sustainability in the Supply Chain80 Questions
Exam 20: Statistical Process Control144 Questions
Exam 21: Supply Chain Management Analytics55 Questions
Exam 22: Decision-Making Tools97 Questions
Exam 23: Linear Programming80 Questions
Exam 24: Transportation Models89 Questions
Exam 25: Waiting-Line Models119 Questions
Exam 26: Learning Curves105 Questions
Exam 27: Simulation75 Questions
Select questions type
Pierre's Motorized Pirogues and Mudboats is setting up an acceptance sampling plan for the special air cleaners he manufactures for his boats.His specifications,and the resulting plan,are shown on the POM for Windows output below.Pierre wants acceptance sampling to remove ALL defects from his production of air cleaners.Explain carefully why this won't happen. 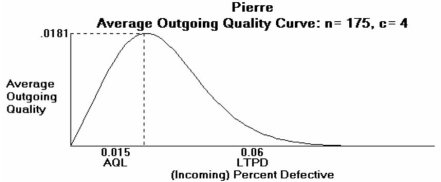
(Essay)
4.9/5  (28)
(28)
What is the statistical process chart used to control the number of defects per unit of output?
(Multiple Choice)
4.8/5 (39)
According to the text,what is the most common choice of limits for control charts?
(Multiple Choice)
4.8/5 (37)
A manufacturer uses statistical process control to control the quality of the firm's products.Samples of 50 of Product A are taken,and a defective/acceptable decision is made on each unit sampled.For Product B,the number of flaws per unit is counted.What type(s)of control charts should be used?
(Multiple Choice)
4.8/5 (42)
Mean charts and range charts complement one another,one detecting shifts in process average,the other detecting shifts in process dispersion.
(True/False)
4.8/5 (29)
If a sample of items is taken and the mean of the sample is outside the control limits,the process is:
(Multiple Choice)
4.8/5 (28)
What are the three possible results (or findings)from the use of control charts?
(Essay)
4.7/5 (38)
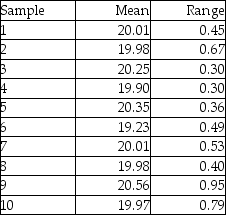
Ten samples of size four were taken from a process,and their weights measured.The sample averages and sample ranges are in the following table.Construct and plot an x-bar and R-chart using these data.Is the process in control?
(Essay)
4.9/5 (34)
The width of a bronze bar is intended to be one-eighth of an inch (0.125 inches).Inspection samples contain five bars each.The average range of these samples is 0.01 inches.What are the upper and lower control limits for the x-bar and R-chart for this process,using 3-sigma limits?
(Essay)
4.9/5 (48)
A woodworker is concerned about the quality of the finished appearance of her work.In sampling units of a split-willow hand-woven basket,she has found the following number of finish defects in ten units sampled: 4,0,3,1,2,0,1,2,0,2.
a.Calculate the average number of defects per basket.
b.If 3-sigma control limits are used,calculate the lower control limit and upper control limit.
(Short Answer)
4.9/5 (35)
Examine the Statistical Process Control outputs below.Answer the following questions.
a.What is the sample size?
b.What is the number of samples?
c.What is the mean of sample 8; what is the range of sample 10?
d..Is this process in control? Explain--a simple Yes or No is insufficient.
e.What additional steps should the quality assurance team take? 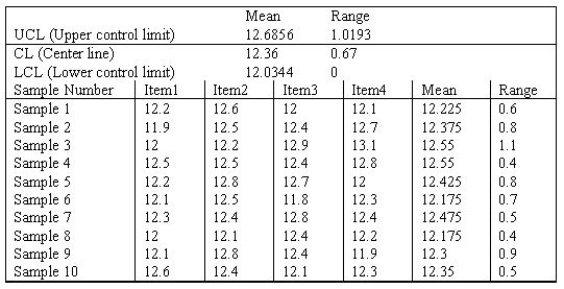
(Essay)
4.7/5 (39)
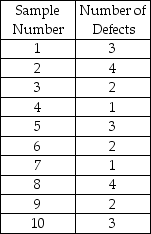
Larry's boat shop wants to monitor the number of blemishes in the paint of each boat.Construct a 3-sigma c-chart to determine if their paint process is in control using the following data.
(Essay)
4.8/5 (40)
A retail store manager is trying to improve and control the rate at which cashiers sign customers up
for store credit cards.Suppose the manager takes 10 samples,each with 100 observations.The p-bar
value is found to be .05,and the manager does not want a lower limit below .0064.What z-value would this imply,and how confident can she be that the true lower limit is greater than or equal to .0064?
(Essay)
4.9/5 (38)
The ________ is the percentage defective in an average lot of goods inspected through acceptance sampling.
(Short Answer)
4.9/5 (41)
Which of the following is TRUE regarding the average outgoing quality level?
(Multiple Choice)
4.8/5 (43)
________ is a method of measuring samples of lots or batches of product against predetermined standards.
(Short Answer)
4.9/5 (36)
Filters
- Essay(0)
- Multiple Choice(0)
- Short Answer(0)
- True False(0)
- Matching(0)