Exam 20: Statistical Process Control
Exam 1: Operations and Productivity126 Questions
Exam 2: Operations Strategy in a Global Environment119 Questions
Exam 3: Project Management120 Questions
Exam 4: Forecasting141 Questions
Exam 5: Design of Goods and Services118 Questions
Exam 6: Managing Quality123 Questions
Exam 7: Process Strategy108 Questions
Exam 8: Capacity and Constraint Management96 Questions
Exam 9: Location Strategies120 Questions
Exam 10: Layout Strategies146 Questions
Exam 11: Human Resources, job Design, and Work Measurement154 Questions
Exam 12: Supply Chain Management144 Questions
Exam 13: Inventory Management163 Questions
Exam 14: Aggregate Planning and Sop116 Questions
Exam 15: Material Requirements Planning Mrpand Erp113 Questions
Exam 16: Short-Term Scheduling116 Questions
Exam 17: Jit, tps, and Lean Operations115 Questions
Exam 18: Maintenance and Reliability111 Questions
Exam 19: Sustainability in the Supply Chain80 Questions
Exam 20: Statistical Process Control144 Questions
Exam 21: Supply Chain Management Analytics55 Questions
Exam 22: Decision-Making Tools97 Questions
Exam 23: Linear Programming80 Questions
Exam 24: Transportation Models89 Questions
Exam 25: Waiting-Line Models119 Questions
Exam 26: Learning Curves105 Questions
Exam 27: Simulation75 Questions
Select questions type
The acceptable quality level (AQL)is the average level of quality we are willing to accept.
(True/False)
4.8/5  (32)
(32)
Which of the following statements about acceptance sampling is true?
(Multiple Choice)
4.8/5 (35)
Which of the following is true regarding the process capability index Cpk?
(Multiple Choice)
4.8/5 (28)
To set x-bar chart upper and lower control limits,one must know the process central line,which is the:
(Multiple Choice)
4.8/5 (28)
If a process has only natural variations,________ percent of the time the sample averages will fall inside the ±3-sigma control limits.
(Short Answer)
4.9/5 (40)
A manager wishes to build a 3-sigma range chart for a process.The sample size is five,the mean of sample means is 16.01,and the average range is 5.3.From Table S6.1,the appropriate value of D3 is 0,and D4 is 2.115.What are the UCL and LCL,respectively,for this range chart?
(Multiple Choice)
4.8/5 (35)
A c-chart is appropriate to plot the number of flaws in a bolt of fabric.
(True/False)
4.8/5 (33)
A process range chart illustrates the amount of dispersion within the samples.
(True/False)
4.9/5 (38)
The causes of variation in statistical process control are:
(Multiple Choice)
4.8/5 (32)
A quality analyst wants to construct a sample mean chart for controlling a packaging process.He knows from past experience that when the process is operating as intended,packaging weight is normally distributed with a mean of twenty ounces,and a process standard deviation of two ounces.Each day last week,he randomly selected four packages and weighed each.The data from that activity appear below.
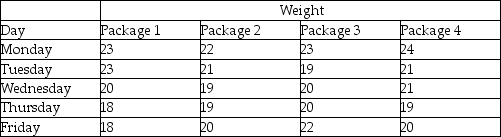 (a)If he sets an upper control limit of 21 and a lower control limit of 19 around the target value of twenty ounces,the control chart is based on what value of z?
(b)With the UCL and LCL of part a,what do you conclude about this process-is it in control?
(a)If he sets an upper control limit of 21 and a lower control limit of 19 around the target value of twenty ounces,the control chart is based on what value of z?
(b)With the UCL and LCL of part a,what do you conclude about this process-is it in control?
(Essay)
4.9/5 (47)
Pierre's Motorized Pirogues and Mudboats is setting up an acceptance sampling plan for the special air cleaners he manufactures for his boats.His specifications,and the resulting plan,are shown on the POM for Windows output below.Pierre is a bit confused.He mistakenly thinks that acceptance sampling will reject all bad lots and accept all good lots.Explain why this will not happen. 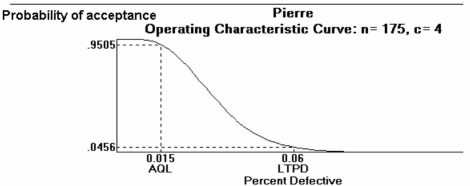
(Essay)
4.8/5 (41)
A process that is in statistical control will always yield products that meet their design specifications.
(True/False)
4.8/5 (36)
Mistakes stemming from workers' inadequate training represent an assignable cause of variation.
(True/False)
4.7/5 (35)
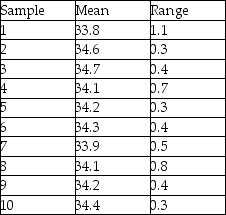
Cartons of Plaster of Paris are supposed to weigh exactly 32 oz.Inspectors want to develop process control charts.They take ten samples of six boxes each and weigh them.Based on the following data,compute the lower and upper control limits and determine whether the process is in control.
(Essay)
4.9/5 (37)
The term ________ is used to describe how well a process makes units within design specifications (or tolerances).
(Short Answer)
4.8/5 (33)
A city police chief decides to do an annual review of the police department by checking the number of monthly complaints.If the total number of complaints in each of the 12 months were 15,18,13,12,16,20,5,10,9,11,8,and 3 and the police chief wants a 90% confidence level,are the complaints in control?
(Essay)
4.8/5 (34)
The defect rate for a product has historically been about 1.6%.What are the upper and lower control chart limits for a p-chart,if you wish to use a sample size of 100 and 3-sigma limits?
(Essay)
4.9/5 (40)
Filters
- Essay(0)
- Multiple Choice(0)
- Short Answer(0)
- True False(0)
- Matching(0)