Exam 20: Statistical Process Control
Exam 1: Operations and Productivity126 Questions
Exam 2: Operations Strategy in a Global Environment119 Questions
Exam 3: Project Management120 Questions
Exam 4: Forecasting141 Questions
Exam 5: Design of Goods and Services118 Questions
Exam 6: Managing Quality123 Questions
Exam 7: Process Strategy108 Questions
Exam 8: Capacity and Constraint Management96 Questions
Exam 9: Location Strategies120 Questions
Exam 10: Layout Strategies146 Questions
Exam 11: Human Resources, job Design, and Work Measurement154 Questions
Exam 12: Supply Chain Management144 Questions
Exam 13: Inventory Management163 Questions
Exam 14: Aggregate Planning and Sop116 Questions
Exam 15: Material Requirements Planning Mrpand Erp113 Questions
Exam 16: Short-Term Scheduling116 Questions
Exam 17: Jit, tps, and Lean Operations115 Questions
Exam 18: Maintenance and Reliability111 Questions
Exam 19: Sustainability in the Supply Chain80 Questions
Exam 20: Statistical Process Control144 Questions
Exam 21: Supply Chain Management Analytics55 Questions
Exam 22: Decision-Making Tools97 Questions
Exam 23: Linear Programming80 Questions
Exam 24: Transportation Models89 Questions
Exam 25: Waiting-Line Models119 Questions
Exam 26: Learning Curves105 Questions
Exam 27: Simulation75 Questions
Select questions type
A process that is assumed to be in control with limits of 89 ± 2 had sample averages for the x-bar chart of the following: 87.1,87,87.2,89,90,88.5,89.5,and 88.Is the process in control?
(Multiple Choice)
4.8/5  (30)
(30)
Under which of the following situations will the average outgoing quality (AOQ)decrease?
(Multiple Choice)
4.8/5 (29)
If  = 23 ounces,σ = 0.4 ounces,and n = 16,what will be the ±3σ control limits for the x-bar chart?
(Multiple Choice)
4.8/5 (35)
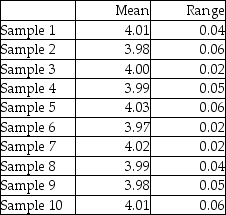
A part that connects two levels should have a distance between the two holes of 4".It has been determined that x-bar and R-charts should be set up to determine if the process is in statistical control.The following ten samples of size four were collected.Calculate the control limits,plot the control charts,and determine if the process is in control.
(Essay)
4.8/5 (39)
The Cpk index measures the difference between the desired and actual dimensions of goods or services produced.
(True/False)
4.9/5 (43)
A bank's manager has videotaped 20 different teller transactions to observe the number of mistakes being made.Ten transactions had no mistakes,five had one mistake and five had two mistakes.Compute proper control limits at the 90% confidence level.
(Essay)
4.9/5 (38)
Define consumer's risk.Is it a Type I or Type II error? What is the symbol for its value?
(Essay)
4.7/5 (33)
The specification for a plastic liner for concrete highway projects calls for a thickness of 6.0 mm ± 0.1 mm.The standard deviation of the process is estimated to be 0.02 mm.What are the upper and lower specification limits for this product? The process is known to operate at a mean thickness of 6.03 mm.What is the Cp and Cpk for this process? About what percent of all units of this liner will meet specifications?
(Essay)
4.9/5 (44)
A process is said to be in statistical control when assignable causes are the only sources of variation.
(True/False)
4.8/5 (35)
A department chair wants to monitor the percentage of failing students in classes in her department.Each class had an enrollment of 50 students last spring.The number of failing students in the 10 classes offered that term were 1,4,2,0,0,0,0,0,0,and 3,respectively.Compute the control limits for a p-chart at the 95% confidence level.Is the process in control?
(Essay)
4.9/5 (35)
If μ = 9 ounces,σ = 0.5 ounces,and n = 9,calculate the 3-sigma control limits for the x-bar chart.
(Short Answer)
4.9/5 (38)
The statistical definition of Six Sigma allows for 3.4 defects per million.This is achieved by what Cpk index value?
(Multiple Choice)
4.7/5 (40)
For a 3-sigma x-bar chart where the process standard deviation is known,the upper control limit:
(Multiple Choice)
4.8/5 (27)
The x-bar chart indicates that a gain or loss of uniformity has occurred in dispersion of a production process.
(True/False)
4.9/5 (44)
The local newspaper receives several complaints per day about typographic errors.Over a seven-day period,the publisher has received calls from readers reporting the following total daily number of errors: 4,3,2,6,7,3,and 9.Based on these data alone,what type of control chart(s)should the publisher use?
(Multiple Choice)
5.0/5 (37)
Filters
- Essay(0)
- Multiple Choice(0)
- Short Answer(0)
- True False(0)
- Matching(0)