Exam 20: Statistical Process Control
Exam 1: Operations and Productivity126 Questions
Exam 2: Operations Strategy in a Global Environment119 Questions
Exam 3: Project Management120 Questions
Exam 4: Forecasting141 Questions
Exam 5: Design of Goods and Services118 Questions
Exam 6: Managing Quality123 Questions
Exam 7: Process Strategy108 Questions
Exam 8: Capacity and Constraint Management96 Questions
Exam 9: Location Strategies120 Questions
Exam 10: Layout Strategies146 Questions
Exam 11: Human Resources, job Design, and Work Measurement154 Questions
Exam 12: Supply Chain Management144 Questions
Exam 13: Inventory Management163 Questions
Exam 14: Aggregate Planning and Sop116 Questions
Exam 15: Material Requirements Planning Mrpand Erp113 Questions
Exam 16: Short-Term Scheduling116 Questions
Exam 17: Jit, tps, and Lean Operations115 Questions
Exam 18: Maintenance and Reliability111 Questions
Exam 19: Sustainability in the Supply Chain80 Questions
Exam 20: Statistical Process Control144 Questions
Exam 21: Supply Chain Management Analytics55 Questions
Exam 22: Decision-Making Tools97 Questions
Exam 23: Linear Programming80 Questions
Exam 24: Transportation Models89 Questions
Exam 25: Waiting-Line Models119 Questions
Exam 26: Learning Curves105 Questions
Exam 27: Simulation75 Questions
Select questions type
The Central Limit Theorem states that when the sample size increases,the distribution of the sample means will approach the normal distribution.
(True/False)
4.9/5  (41)
(41)
Plots of sample ranges indicate that the most recent value is below the lower control limit.What course of action would you recommend?
(Multiple Choice)
4.8/5 (34)
The purpose of process control is to detect when natural causes of variation are present.
(True/False)
4.8/5 (37)
The purpose of an x-bar chart is to determine whether there has been a:
(Multiple Choice)
4.8/5 (33)
The ________ is the lowest level of quality that we are willing to accept.
(Short Answer)
4.9/5 (37)
A hospital-billing auditor has been inspecting patient bills.While almost all bills contain some errors,the auditor is looking now for large errors (errors in excess of $250).Each day last week,the auditor examined 100 bills and found an average defect rate of 16%.Calculate the upper and lower limits for the billing process for 99.73% confidence.
(Essay)
4.7/5 (30)
A consultant has been brought in to a manufacturing plant to help apply Six Sigma principles.Her first task is to work on the production of rubber balls.The upper and lower spec limits are 21 and 19 cm,respectively.The consultant takes ten samples of size five and computes the sample standard deviation to be .7 cm and the sample mean to be 19.89 cm.Compute Cp and Cpk for the process.Give the consultant advice on what to do with the process based on your findings.
(Essay)
4.9/5 (35)
Briefly explain what the Central Limit Theorem has to do with control charts.
(Essay)
4.8/5 (32)
A small,independent amusement park collects data on the number of cars with out-of-state license plates.The sample size is fixed at n=25 each day.Data from the previous 10 days indicate the following number of out-of-state license plates:
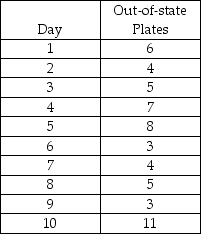 (a)Calculate the overall proportion of "tourists" (cars with out-of-state plates)and the standard deviation of proportions.
(b)Using ±3σ limits,calculate the LCL and UCL for these data.
(c)Is the process under control? Explain.
(a)Calculate the overall proportion of "tourists" (cars with out-of-state plates)and the standard deviation of proportions.
(b)Using ±3σ limits,calculate the LCL and UCL for these data.
(c)Is the process under control? Explain.
(Essay)
4.8/5 (38)
A nationwide parcel delivery service keeps track of the number of late deliveries (more than 30 minutes past the time promised to clients)per day.They plan on using a control chart to plot their results.Which type of control chart(s)would you recommend?
(Multiple Choice)
4.8/5 (36)
A manager wants to build 3-sigma x-bar control limits for a process.The target value for the mean of the process is 10 units,and the standard deviation of the process is 6.If samples of size 9 are to be taken,what will be the upper and lower control limits,respectively?
(Multiple Choice)
4.8/5 (42)
The mean and standard deviations for a process are μ = 90 and σ = 9,respectively.For the variable control chart,a sample size of 16 will be used.Calculate the standard deviation of the sample means.
(Essay)
4.8/5 (41)
The number of late insurance claim payouts per 100 should be measured with what type of control chart?
(Multiple Choice)
4.8/5 (38)
A(n)________ is a graph that describes how well an acceptance plan discriminates between good and bad lots.
(Short Answer)
4.7/5 (28)
A quality analyst wants to construct a sample mean chart for controlling a packaging process.He knows from past experience that the process standard deviation is two ounces.Each day last week,he randomly selected four packages and weighed each.The data from that activity appear below.
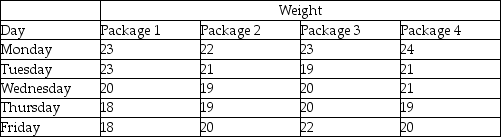 (a)Calculate all sample means and the mean of all sample means.
(b)Calculate upper and lower 2-sigma x-bar chart control limits that allow for natural variations.
(c)Based on the x-bar chart,is this process in control?
(a)Calculate all sample means and the mean of all sample means.
(b)Calculate upper and lower 2-sigma x-bar chart control limits that allow for natural variations.
(c)Based on the x-bar chart,is this process in control?
(Essay)
4.9/5 (35)
In most acceptance sampling plans,when a lot is rejected,the entire lot is inspected and all defective items are replaced.When using this technique the AOQ:
(Multiple Choice)
4.9/5 (39)
Filters
- Essay(0)
- Multiple Choice(0)
- Short Answer(0)
- True False(0)
- Matching(0)