Exam 19: Statistical Process Control
Exam 1: Operations and Productivity127 Questions
Exam 2: Operations Strategy in a Global Environment119 Questions
Exam 3: Project Management120 Questions
Exam 4: Forecasting141 Questions
Exam 5: Design of Goods and Services118 Questions
Exam 6: Managing Quality127 Questions
Exam 7: Process Strategy108 Questions
Exam 8: Location Strategies120 Questions
Exam 9: Layout Strategies145 Questions
Exam 10: Human Resources,job Design,and Work Measurement154 Questions
Exam 11: Supply Chain Management145 Questions
Exam 12: Inventory Management163 Questions
Exam 13: Aggregate Planning and Sop116 Questions
Exam 14: Material Requirements Planning Mrpand Erp116 Questions
Exam 15: Short-Term Scheduling115 Questions
Exam 16: Jit,tps,and Lean Operations115 Questions
Exam 17: Maintenance and Reliability111 Questions
Exam 18: Sustainability in the Supply Chain80 Questions
Exam 19: Statistical Process Control144 Questions
Exam 20: Capacity and Constraint Management96 Questions
Exam 21: Supply Chain Management Analytics55 Questions
Exam 22: Decision-Making Tools96 Questions
Exam 23: Linear Programming88 Questions
Exam 24: Transportation Models89 Questions
Exam 25: Waiting-Line Models119 Questions
Exam 26: Learning Curves110 Questions
Exam 27: Simulation74 Questions
Select questions type
A manufacturer uses statistical process control to control the quality of the firm's products.Samples of 50 of Product A are taken,and a defective/acceptable decision is made on each unit sampled.For Product B,the number of flaws per unit is counted.What type(s)of control charts should be used?
(Multiple Choice)
4.8/5  (31)
(31)
The x-bar chart,like the c-chart,is based on the exponential distribution.
(True/False)
4.8/5 (30)
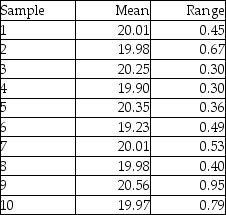
Ten samples of size four were taken from a process,and their weights measured.The sample averages and sample ranges are in the following table.Construct and plot an x-bar and R-chart using these data.Is the process in control?
(Essay)
4.8/5 (45)
A woodworker is concerned about the quality of the finished appearance of her work.In sampling units of a split-willow hand-woven basket,she has found the following number of finish defects in ten units sampled: 4,0,3,1,2,0,1,2,0,2.
a.Calculate the average number of defects per basket.
b.If 3-sigma control limits are used,calculate the lower control limit and upper control limit.
(Essay)
4.8/5 (35)
Repeated sampling of a certain process shows the average of all sample ranges to be 1.0 cm.The sample size has been constant at n = 5.What are the 3-sigma control limits for this R-chart?
(Essay)
4.8/5 (37)
If μ = 9 ounces,σ = 0.5 ounces,and n = 9,calculate the 3-sigma control limits for the x-bar chart.
(Essay)
4.9/5 (29)
A process that is in statistical control will always yield products that meet their design specifications.
(True/False)
4.8/5 (35)
For a 3-sigma x-bar chart where the process standard deviation is known,the upper control limit:
(Multiple Choice)
4.8/5 (40)
To set x-bar chart upper and lower control limits,one must know the process central line,which is the:
(Multiple Choice)
4.8/5 (35)
A local manufacturer supplies you with parts,and you would like to install a quality monitoring system at his factory for these parts.Historically,the defect rate for these parts has been 1.25 percent (You've observed this from your acceptance sampling procedures,which you would like to discontinue).Develop ± 3σ control limits for this process.Assume the sample size will be 200 items.
(Essay)
4.8/5 (28)
A process range chart illustrates the amount of dispersion within the samples.
(True/False)
4.8/5 (32)
When a lot has been accepted by acceptance sampling,we know that:
(Multiple Choice)
4.8/5 (30)
A hospital-billing auditor has been inspecting patient bills.While almost all bills contain some errors,the auditor is looking now for large errors (errors in excess of $250).Each day last week,the auditor examined 100 bills and found an average defect rate of 16%.Calculate the upper and lower limits for the billing process for 99.73% confidence.
(Essay)
4.9/5 (35)
Acceptance sampling accepts or rejects an entire lot based on the information contained in the sample.
(True/False)
4.8/5 (30)
What are the three possible results (or findings)from the use of control charts?
(Essay)
4.8/5 (38)
The term ________ is used to describe how well a process makes units within design specifications (or tolerances).
(Essay)
4.9/5 (39)
Filters
- Essay(0)
- Multiple Choice(0)
- Short Answer(0)
- True False(0)
- Matching(0)