Exam 19: Statistical Process Control
Exam 1: Operations and Productivity127 Questions
Exam 2: Operations Strategy in a Global Environment119 Questions
Exam 3: Project Management120 Questions
Exam 4: Forecasting141 Questions
Exam 5: Design of Goods and Services118 Questions
Exam 6: Managing Quality127 Questions
Exam 7: Process Strategy108 Questions
Exam 8: Location Strategies120 Questions
Exam 9: Layout Strategies145 Questions
Exam 10: Human Resources,job Design,and Work Measurement154 Questions
Exam 11: Supply Chain Management145 Questions
Exam 12: Inventory Management163 Questions
Exam 13: Aggregate Planning and Sop116 Questions
Exam 14: Material Requirements Planning Mrpand Erp116 Questions
Exam 15: Short-Term Scheduling115 Questions
Exam 16: Jit,tps,and Lean Operations115 Questions
Exam 17: Maintenance and Reliability111 Questions
Exam 18: Sustainability in the Supply Chain80 Questions
Exam 19: Statistical Process Control144 Questions
Exam 20: Capacity and Constraint Management96 Questions
Exam 21: Supply Chain Management Analytics55 Questions
Exam 22: Decision-Making Tools96 Questions
Exam 23: Linear Programming88 Questions
Exam 24: Transportation Models89 Questions
Exam 25: Waiting-Line Models119 Questions
Exam 26: Learning Curves110 Questions
Exam 27: Simulation74 Questions
Select questions type
The ________ is the percentage defective in an average lot of goods inspected through acceptance sampling.
(Essay)
4.8/5  (34)
(34)
If  = 23 ounces,σ = 0.4 ounces,and n = 16,what will be the ±3σ control limits for the x-bar chart?
(Multiple Choice)
4.7/5 (34)
Control charts for variables are based on data that come from:
(Multiple Choice)
4.8/5 (37)
If the process average is in control,then the process range must also be in control.
(True/False)
4.8/5 (32)
If a sample of items is taken and the mean of the sample is outside the control limits,the process is:
(Multiple Choice)
5.0/5 (37)
The process capability measures Cp and Cpk differ because:
(Multiple Choice)
4.8/5 (33)
Mean charts and range charts complement one another,one detecting shifts in process average,the other detecting shifts in process dispersion.
(True/False)
4.8/5 (30)
An operator trainee is attempting to monitor a filling process that has an overall average of 705 cc.The average range is 17 cc.If you use a sample size of 6,what are the upper and lower control limits for the x-bar chart and R-chart?
(Essay)
4.9/5 (37)
Ten samples of a process measuring the number of returns per 100 receipts were taken for a local retail store.The number of returns were 10,9,11,7,3,12,8,4,6,and 11.Find the standard deviation of the sampling distribution for the p-bar chart.
(Multiple Choice)
4.9/5 (35)
An acceptance sampling plan is to be designed to meet the organization's targets for product quality and risk levels.Which of the following is true?
(Multiple Choice)
4.9/5 (36)
Define consumer's risk.Is it a Type I or Type II error? What is the symbol for its value?
(Essay)
4.7/5 (38)
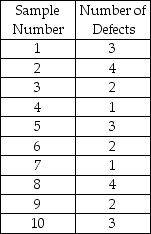
Larry's boat shop wants to monitor the number of blemishes in the paint of each boat.Construct a 3-sigma c-chart to determine if their paint process is in control using the following data.
(Essay)
4.9/5 (39)
The specifications for a manifold gasket that installs between two engine parts calls for a thickness of 2.500 mm ± .020 mm.The standard deviation of the process is estimated to be 0.004 mm.The process is currently operating at a mean thickness of 2.50 mm.(a)What are the upper and lower specification limits for this product? (b)What is the Cp for this process? (c)The purchaser of these parts requires a capability index of 1.50.Is this process capable? Is this process good enough for the supplier? (d)If the process mean were to drift from its setting of 2.500 mm to a new mean of 2.497,would the process still be good enough for the supplier's needs?
(Essay)
4.9/5 (37)
In acceptance sampling,a manager can reach the wrong conclusion if the sample is not representative of the population it was drawn from.
(True/False)
4.8/5 (29)
A department chair wants to monitor the percentage of failing students in classes in her department.Each class had an enrollment of 50 students last spring.The number of failing students in the 10 classes offered that term were 1,4,2,0,0,0,0,0,0,and 3,respectively.Compute the control limits for a p-chart at the 95% confidence level.Is the process in control?
(Essay)
4.9/5 (38)
Filters
- Essay(0)
- Multiple Choice(0)
- Short Answer(0)
- True False(0)
- Matching(0)