Exam 19: Statistical Process Control
Exam 1: Operations and Productivity127 Questions
Exam 2: Operations Strategy in a Global Environment119 Questions
Exam 3: Project Management120 Questions
Exam 4: Forecasting141 Questions
Exam 5: Design of Goods and Services118 Questions
Exam 6: Managing Quality127 Questions
Exam 7: Process Strategy108 Questions
Exam 8: Location Strategies120 Questions
Exam 9: Layout Strategies145 Questions
Exam 10: Human Resources,job Design,and Work Measurement154 Questions
Exam 11: Supply Chain Management145 Questions
Exam 12: Inventory Management163 Questions
Exam 13: Aggregate Planning and Sop116 Questions
Exam 14: Material Requirements Planning Mrpand Erp116 Questions
Exam 15: Short-Term Scheduling115 Questions
Exam 16: Jit,tps,and Lean Operations115 Questions
Exam 17: Maintenance and Reliability111 Questions
Exam 18: Sustainability in the Supply Chain80 Questions
Exam 19: Statistical Process Control144 Questions
Exam 20: Capacity and Constraint Management96 Questions
Exam 21: Supply Chain Management Analytics55 Questions
Exam 22: Decision-Making Tools96 Questions
Exam 23: Linear Programming88 Questions
Exam 24: Transportation Models89 Questions
Exam 25: Waiting-Line Models119 Questions
Exam 26: Learning Curves110 Questions
Exam 27: Simulation74 Questions
Select questions type
A(n)________ is a graph that describes how well an acceptance plan discriminates between good and bad lots.
(Essay)
4.9/5  (29)
(29)
The specification for a plastic liner for concrete highway projects calls for a thickness of 6.0 mm ± 0.1 mm.The standard deviation of the process is estimated to be 0.02 mm.What are the upper and lower specification limits for this product? The process is known to operate at a mean thickness of 6.03 mm.What is the Cp and Cpk for this process? About what percent of all units of this liner will meet specifications?
(Essay)
4.9/5 (42)
An acceptance sampling plan must define "good lots" and "bad lots" and specify the risk level associated with each one.
(True/False)
4.8/5 (39)
The usual purpose of an R-chart is to signal whether there has been a:
(Multiple Choice)
4.8/5 (37)
The x-bar chart indicates that a gain or loss of uniformity has occurred in dispersion of a production process.
(True/False)
4.8/5 (34)
Which of the following statements about acceptance sampling is true?
(Multiple Choice)
4.8/5 (35)
McDaniel Shipyards wants to develop a control chart to assess the quality of its steel plate.They take ten sheets of 1" steel plate and compute the number of cosmetic flaws on each roll.Each sheet is 20' by 100'.Based on the following data,develop limits for the 3-sigma control chart,plot the control chart,and determine whether the process is in control.
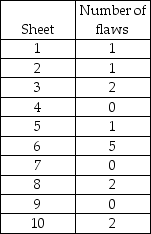
(Essay)
4.8/5 (35)
A nationwide parcel delivery service keeps track of the number of late deliveries (more than 30 minutes past the time promised to clients)per day.They plan on using a control chart to plot their results.Which type of control chart(s)would you recommend?
(Multiple Choice)
4.8/5 (35)
In statistical process control,the range is often used as a substitute for the standard deviation.
(True/False)
4.8/5 (41)
The probability of rejecting a good lot is known as consumer's risk.
(True/False)
4.7/5 (41)
Averages of small samples,not individual measurements,are generally used in statistical process control.
(True/False)
4.9/5 (40)
A quality analyst wants to construct a sample mean chart for controlling a packaging process.He knows from past experience that when the process is operating as intended,packaging weight is normally distributed with a mean of twenty ounces,and a process standard deviation of two ounces.Each day last week,he randomly selected four packages and weighed each.The data from that activity appear below.
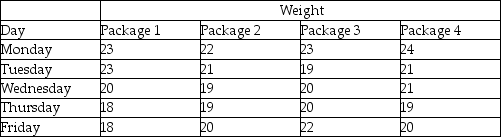 (a)If he sets an upper control limit of 21 and a lower control limit of 19 around the target value of twenty ounces,the control chart is based on what value of z?
(b)With the UCL and LCL of part a,what do you conclude about this process-is it in control?
(a)If he sets an upper control limit of 21 and a lower control limit of 19 around the target value of twenty ounces,the control chart is based on what value of z?
(b)With the UCL and LCL of part a,what do you conclude about this process-is it in control?
(Essay)
4.8/5 (38)
The Cpk index measures the difference between the desired and actual dimensions of goods or services produced.
(True/False)
4.8/5 (37)
An x-bar control chart was examined and no data points fell outside of the limits.Can this process be considered in control?
(Multiple Choice)
4.8/5 (36)
Briefly explain what the Central Limit Theorem has to do with control charts.
(Essay)
5.0/5 (47)
Filters
- Essay(0)
- Multiple Choice(0)
- Short Answer(0)
- True False(0)
- Matching(0)