Exam 14: Simple Linear Regression
Exam 1: Data and Statistics98 Questions
Exam 2: Descriptive Statistics: Tabular and Graphical Displays62 Questions
Exam 3: Descriptive Statistics: Numerical Measures173 Questions
Exam 4: Introduction to Probability138 Questions
Exam 5: Discrete Probability Distributions123 Questions
Exam 6: Continuous Probability Distributions174 Questions
Exam 7: Sampling and Sampling Distributions133 Questions
Exam 8: Interval Estimation137 Questions
Exam 9: Hypothesis Tests148 Questions
Exam 10: Inference About Means and Proportions With Two Populations121 Questions
Exam 11: Inferences About Population Variances90 Questions
Exam 12: Comparing Multiple Proportions, Test of Independence and Goodness of Fit90 Questions
Exam 13: Experimental Design and Analysis of Variance115 Questions
Exam 14: Simple Linear Regression146 Questions
Exam 15: Multiple Regression115 Questions
Exam 16: Regression Analysis: Model Building76 Questions
Exam 17: Time Series Analysis and Forecasting68 Questions
Exam 18: Nonparametric Methods81 Questions
Exam 19: Statistical Methods for Quality Control29 Questions
Exam 20: Index Numbers52 Questions
Exam 21: Decision Analysis on Website65 Questions
Exam 22: Sample Survey on Website63 Questions
Select questions type
Exhibit 14-9
A regression and correlation analysis resulted in the following information regarding a dependent variable (y) and an independent variable (x). 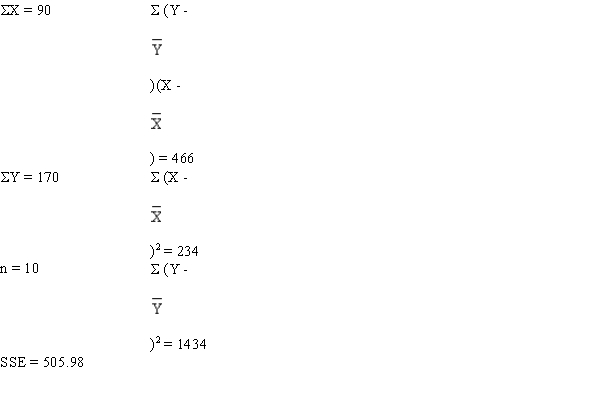 -Refer to Exhibit 14-9. The sum of squares due to regression (SSR) is
(Multiple Choice)
4.8/5  (41)
(41)
In regression analysis, if the independent variable is measured in pounds, the dependent variable
(Multiple Choice)
4.8/5 (31)
If the coefficient of correlation is 0.90, then the coefficient of determination
(Multiple Choice)
4.9/5 (46)
If there is a very weak correlation between two variables, then the coefficient of determination must be
(Multiple Choice)
4.9/5 (33)
Shown below is a portion of a computer output for a regression analysis relating supply (Y in thousands of units) and unit price (X in thousands of dollars). 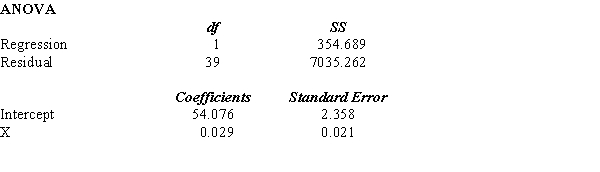 a. What has been the sample size for this problem?
b. Perform a t test and determine whether or not supply and unit price are related. Let = 0.05.
c. Perform and F test and determine whether or not supply and unit price are related. Let = 0.05.
d. Compute the coefficient of determination and fully interpret its meaning. Be very specific.e. Compute the coefficient of correlation and explain the relationship between supply and unit price.f. Predict the supply (in units) when the unit price is $50,000.
a. What has been the sample size for this problem?
b. Perform a t test and determine whether or not supply and unit price are related. Let = 0.05.
c. Perform and F test and determine whether or not supply and unit price are related. Let = 0.05.
d. Compute the coefficient of determination and fully interpret its meaning. Be very specific.e. Compute the coefficient of correlation and explain the relationship between supply and unit price.f. Predict the supply (in units) when the unit price is $50,000.
(Essay)
4.8/5 (38)
If the coefficient of correlation is a positive value, then the regression equation
(Multiple Choice)
4.8/5 (25)
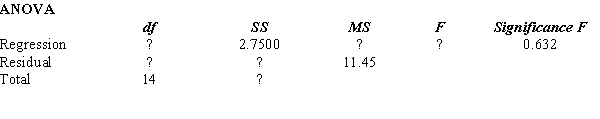
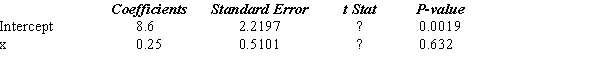
Part of an Excel output relating X (independent variable) and Y (dependent variable) is shown below. Fill in all the blanks marked with "?". 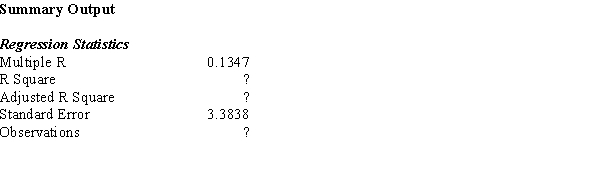
(Essay)
4.8/5 (38)
The owner of a bakery wants to analyze the relationship between the expenditure of a customer and the customer's income. A sample of 5 customers is taken and the following information was obtained. 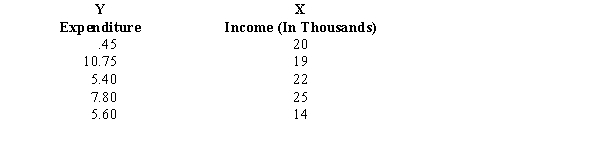 The least squares estimated line is
  = 4.348 + 0.0826 X.
a.Obtain a measure of how well the estimated regression line fits the data.
b.You want to test to see if there is a significant relationship between expenditure and income at the 5% level of significance. Be sure to state the null and alternative hypotheses.
c.Construct a 95% confidence interval estimate for the average expenditure for all customers with an income of $20,000.
d.Construct a 95% confidence interval estimate for the expenditure of one customer whose income is $20,000.
= 4.348 + 0.0826 X.
a.Obtain a measure of how well the estimated regression line fits the data.
b.You want to test to see if there is a significant relationship between expenditure and income at the 5% level of significance. Be sure to state the null and alternative hypotheses.
c.Construct a 95% confidence interval estimate for the average expenditure for all customers with an income of $20,000.
d.Construct a 95% confidence interval estimate for the expenditure of one customer whose income is $20,000.
(Essay)
4.8/5 (38)
If the coefficient of determination is equal to 1, then the coefficient of correlation
(Multiple Choice)
4.9/5 (38)
The interval estimate of the mean value of y for a given value of x is
(Multiple Choice)
4.8/5 (32)
Exhibit 14 - 1
The following information regarding a dependent variable (Y) and an independent variable (X) is provided. 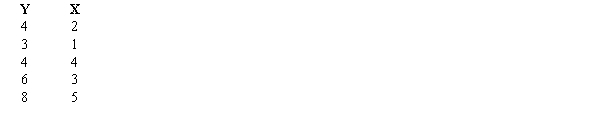 SSE = 6
SST = 16
-Refer to Exhibit 14-1. The MSE is
SSE = 6
SST = 16
-Refer to Exhibit 14-1. The MSE is
(Multiple Choice)
4.7/5 (34)
Exhibit 14 - 1
The following information regarding a dependent variable (Y) and an independent variable (X) is provided. SSE = 6
SST = 16
-Refer to Exhibit 14-1. The coefficient of correlation is
(Multiple Choice)
4.9/5 (37)
A regression analysis between sales (Y in $1000) and advertising (X in dollars) resulted in the following equation  = 30,000 + 4 X The above equation implies that an
(Multiple Choice)
4.9/5 (41)
The following data represent a company's yearly sales volume and its advertising expenditure over a period of 8 years. 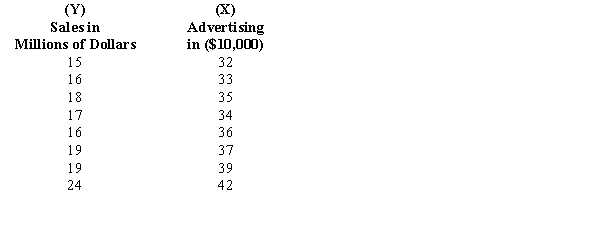 a. Develop a scatter diagram of sales versus advertising and explain what it shows regarding the relationship between sales and advertising.
b. Use the method of least squares to compute an estimated regression line between sales and advertising.
c. If the company's advertising expenditure is $400,000, what are the predicted sales? Give the answer in dollars.
d. What does the slope of the estimated regression line indicate?
e. Compute the coefficient of determination and fully interpret its meaning.
f. Use the F test to determine whether or not the regression model is significant at = 0.05.
a. Develop a scatter diagram of sales versus advertising and explain what it shows regarding the relationship between sales and advertising.
b. Use the method of least squares to compute an estimated regression line between sales and advertising.
c. If the company's advertising expenditure is $400,000, what are the predicted sales? Give the answer in dollars.
d. What does the slope of the estimated regression line indicate?
e. Compute the coefficient of determination and fully interpret its meaning.
f. Use the F test to determine whether or not the regression model is significant at = 0.05.
(Essay)
4.9/5 (34)
In a simple regression analysis (where Y is a dependent and X an independent variable), if the Y intercept is positive, then
(Multiple Choice)
4.9/5 (38)
Shown below is a portion of a computer output for a regression analysis relating Y (demand) and X (unit price). 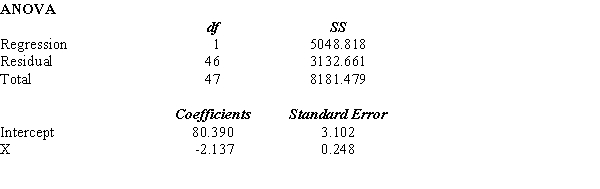 a.Perform a t test and determine whether or not demand and unit price are related. Let = 0.05.
b.Perform an F test and determine whether or not demand and unit price are related. Let = 0.05.
c.Compute the coefficient of determination and fully interpret its meaning. Be very specific.
d.Compute the coefficient of correlation and explain the relationship between demand and unit price.
a.Perform a t test and determine whether or not demand and unit price are related. Let = 0.05.
b.Perform an F test and determine whether or not demand and unit price are related. Let = 0.05.
c.Compute the coefficient of determination and fully interpret its meaning. Be very specific.
d.Compute the coefficient of correlation and explain the relationship between demand and unit price.
(Essay)
4.9/5 (35)
Exhibit 14 - 1
The following information regarding a dependent variable (Y) and an independent variable (X) is provided. SSE = 6
SST = 16
-Refer to Exhibit 14-1. The least squares estimate of the Y intercept is
(Multiple Choice)
4.9/5 (33)
Exhibit 14-3
You are given the following information about y and x. 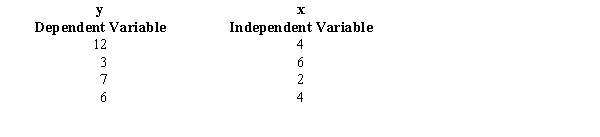 -Refer to Exhibit 14-3. The sample correlation coefficient equals
(Multiple Choice)
4.8/5 (24)
Filters
- Essay(0)
- Multiple Choice(0)
- Short Answer(0)
- True False(0)
- Matching(0)