Exam 14: Simple Linear Regression
Exam 1: Data and Statistics98 Questions
Exam 2: Descriptive Statistics: Tabular and Graphical Displays62 Questions
Exam 3: Descriptive Statistics: Numerical Measures173 Questions
Exam 4: Introduction to Probability138 Questions
Exam 5: Discrete Probability Distributions123 Questions
Exam 6: Continuous Probability Distributions174 Questions
Exam 7: Sampling and Sampling Distributions133 Questions
Exam 8: Interval Estimation137 Questions
Exam 9: Hypothesis Tests148 Questions
Exam 10: Inference About Means and Proportions With Two Populations121 Questions
Exam 11: Inferences About Population Variances90 Questions
Exam 12: Comparing Multiple Proportions, Test of Independence and Goodness of Fit90 Questions
Exam 13: Experimental Design and Analysis of Variance115 Questions
Exam 14: Simple Linear Regression146 Questions
Exam 15: Multiple Regression115 Questions
Exam 16: Regression Analysis: Model Building76 Questions
Exam 17: Time Series Analysis and Forecasting68 Questions
Exam 18: Nonparametric Methods81 Questions
Exam 19: Statistical Methods for Quality Control29 Questions
Exam 20: Index Numbers52 Questions
Exam 21: Decision Analysis on Website65 Questions
Exam 22: Sample Survey on Website63 Questions
Select questions type
Exhibit 14-10
The following information regarding a dependent variable Y and an independent variable X is provided. 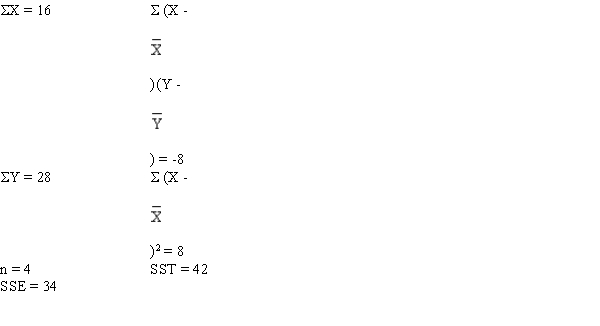 -Refer to Exhibit 14-10. The point estimate of Y when X = 3 is
(Multiple Choice)
4.9/5  (28)
(28)
Exhibit 14-10
The following information regarding a dependent variable Y and an independent variable X is provided.
-Refer to Exhibit 14-10. The Y intercept is
(Multiple Choice)
4.9/5 (24)
Shown below is a portion of the computer output for a regression analysis relating sales (Y in millions of dollars) and advertising expenditure (X in thousands of dollars). 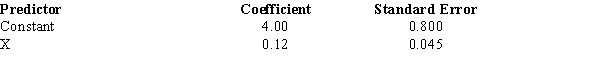
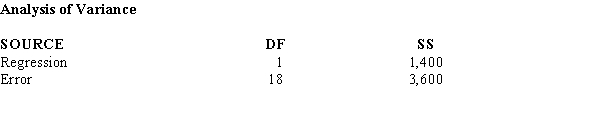 a. What has been the sample size for the above?
b. Perform a t test and determine whether or not advertising and sales are related. Let = 0.05.
c. Compute the coefficient of determination.
d. Interpret the meaning of the value of the coefficient of determination that you found in Part c. Be very specific.e. Use the estimated regression equation and predict sales for an advertising expenditure of $4,000. Give your answer in dollars.
a. What has been the sample size for the above?
b. Perform a t test and determine whether or not advertising and sales are related. Let = 0.05.
c. Compute the coefficient of determination.
d. Interpret the meaning of the value of the coefficient of determination that you found in Part c. Be very specific.e. Use the estimated regression equation and predict sales for an advertising expenditure of $4,000. Give your answer in dollars.
(Essay)
4.8/5 (44)
If the coefficient of correlation is a negative value, then the coefficient of determination
(Multiple Choice)
4.9/5 (30)
Exhibit 14-6
For the following data the value of SSE = 0.4130. 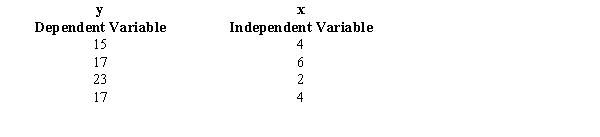 -Refer to Exhibit 14-6. The slope of the regression equation is
(Multiple Choice)
4.7/5 (23)
Exhibit 14-4
Regression analysis was applied between sales data (Y in $1,000s) and advertising data (x in $100s) and the following information was obtained.  = 12 + 1.8 x
n = 17
SSR = 225
SSE = 75
Sb1 = 0.2683
-Refer to Exhibit 14-4. To perform an F test, the p-value is
= 12 + 1.8 x
n = 17
SSR = 225
SSE = 75
Sb1 = 0.2683
-Refer to Exhibit 14-4. To perform an F test, the p-value is
(Multiple Choice)
4.8/5 (33)
In regression analysis if the dependent variable is measured in dollars, the independent variable
(Multiple Choice)
4.9/5 (42)
Exhibit 14-8
The following information regarding a dependent variable Y and an independent variable X is provided 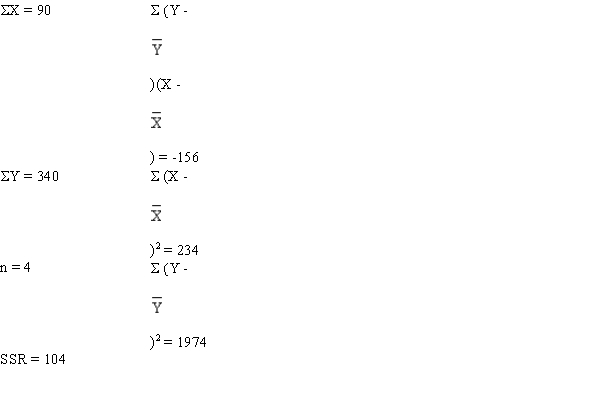 -Refer to Exhibit 14-8. The mean square error (MSE) is
(Multiple Choice)
4.8/5 (43)
Exhibit 14-4
Regression analysis was applied between sales data (Y in $1,000s) and advertising data (x in $100s) and the following information was obtained. = 12 + 1.8 x
n = 17
SSR = 225
SSE = 75
Sb1 = 0.2683
-Refer to Exhibit 14-4. Based on the above estimated regression equation, if advertising is $3,000, then the point estimate for sales (in dollars) is
(Multiple Choice)
4.9/5 (40)
In a regression analysis if SSE = 200 and SSR = 300, then the coefficient of determination is
(Multiple Choice)
4.8/5 (33)
In regression analysis, the unbiased estimate of the variance is
(Multiple Choice)
4.8/5 (42)
A company has recorded data on the daily demand for its product (Y in thousands of units) and the unit price (X in hundreds of dollars). A sample of 15 days demand and associated prices resulted in the following data. X = 75
Y-  ) X-
) X-  ) = -59
Y = 135
X-
) = -59
Y = 135
X-  )2 = 94
Y-
)2 = 94
Y-  )2 = 100
SSE = 62.9681
a.Using the above information, develop the least-squares estimated regression line and write the equation.
b.Compute the coefficient of determination.
c.Perform an F test and determine whether or not there is a significant relationship between demand and unit price. Let = 0.05.
d.Would the demand ever reach zero? If yes, at what price would the demand be zero?
)2 = 100
SSE = 62.9681
a.Using the above information, develop the least-squares estimated regression line and write the equation.
b.Compute the coefficient of determination.
c.Perform an F test and determine whether or not there is a significant relationship between demand and unit price. Let = 0.05.
d.Would the demand ever reach zero? If yes, at what price would the demand be zero?
(Essay)
4.8/5 (32)
Regression analysis is a statistical procedure for developing a mathematical equation that describes how
(Multiple Choice)
4.9/5 (38)
If the coefficient of correlation is a positive value, then
(Multiple Choice)
4.8/5 (29)
Exhibit 14-2
You are given the following information about y and x. 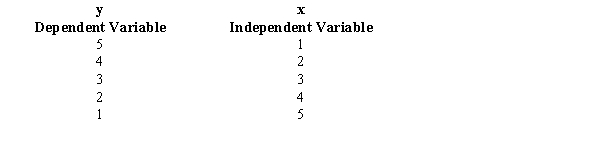 -Refer to Exhibit 14-2. The sample correlation coefficient equals
(Multiple Choice)
4.8/5 (47)
In a regression analysis the standard error is determined to be 4. In this situation the MSE
(Multiple Choice)
4.6/5 (19)
Exhibit 14-7
You are given the following information about y and x. 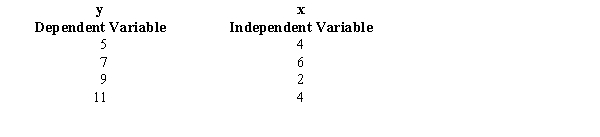 -Refer to Exhibit 14-7. The least squares estimate of b0 (intercept) equals
(Multiple Choice)
4.8/5 (34)
In regression and correlation analysis, if SSE and SST are known, then with this information the
(Multiple Choice)
4.7/5 (37)
Filters
- Essay(0)
- Multiple Choice(0)
- Short Answer(0)
- True False(0)
- Matching(0)