Exam 14: Simple Linear Regression
Exam 1: Data and Statistics98 Questions
Exam 2: Descriptive Statistics: Tabular and Graphical Displays62 Questions
Exam 3: Descriptive Statistics: Numerical Measures173 Questions
Exam 4: Introduction to Probability138 Questions
Exam 5: Discrete Probability Distributions123 Questions
Exam 6: Continuous Probability Distributions174 Questions
Exam 7: Sampling and Sampling Distributions133 Questions
Exam 8: Interval Estimation137 Questions
Exam 9: Hypothesis Tests148 Questions
Exam 10: Inference About Means and Proportions With Two Populations121 Questions
Exam 11: Inferences About Population Variances90 Questions
Exam 12: Comparing Multiple Proportions, Test of Independence and Goodness of Fit90 Questions
Exam 13: Experimental Design and Analysis of Variance115 Questions
Exam 14: Simple Linear Regression146 Questions
Exam 15: Multiple Regression115 Questions
Exam 16: Regression Analysis: Model Building76 Questions
Exam 17: Time Series Analysis and Forecasting68 Questions
Exam 18: Nonparametric Methods81 Questions
Exam 19: Statistical Methods for Quality Control29 Questions
Exam 20: Index Numbers52 Questions
Exam 21: Decision Analysis on Website65 Questions
Exam 22: Sample Survey on Website63 Questions
Select questions type
If a data set has SSR = 400 and SSE = 100, then the coefficient of determination is
(Multiple Choice)
4.8/5  (28)
(28)
In a regression analysis, the error term is a random variable with a mean or expected value of
(Multiple Choice)
4.9/5 (29)
Exhibit 14 - 1
The following information regarding a dependent variable (Y) and an independent variable (X) is provided. 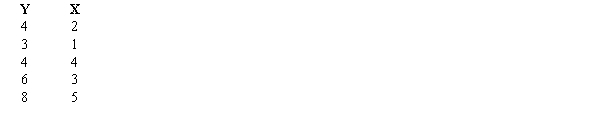 SSE = 6
SST = 16
-Refer to Exhibit 14-1. The coefficient of determination is
SSE = 6
SST = 16
-Refer to Exhibit 14-1. The coefficient of determination is
(Multiple Choice)
4.8/5 (37)
Exhibit 14-6
For the following data the value of SSE = 0.4130. 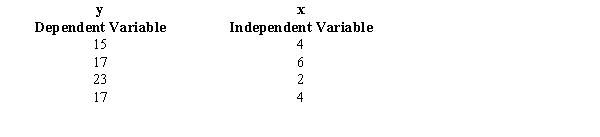 -Refer to Exhibit 14-6. The y intercept is
(Multiple Choice)
4.9/5 (34)
In regression analysis, which of the following is not a required assumption about the error term ?
(Multiple Choice)
4.9/5 (29)
Exhibit 14-3
You are given the following information about y and x. 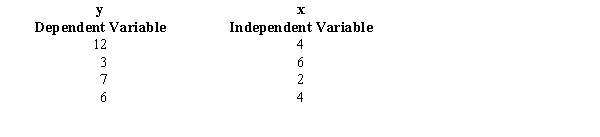 -Refer to Exhibit 14-3. The least squares estimate of b0 equals
(Multiple Choice)
4.9/5 (32)
The following data represent the number of flash drives sold per day at a local computer shop and their prices.  a.Develop a least-squares regression line and explain what the slope of the line indicates.
b.Compute the coefficient of determination and comment on the strength of relationship between x and y.
c.Compute the sample correlation coefficient between the price and the number of flash drives sold. Use = 0.01 to test the relationship between x and y.
a.Develop a least-squares regression line and explain what the slope of the line indicates.
b.Compute the coefficient of determination and comment on the strength of relationship between x and y.
c.Compute the sample correlation coefficient between the price and the number of flash drives sold. Use = 0.01 to test the relationship between x and y.
(Essay)
4.8/5 (31)
The equation that describes how the dependent variable (y) is related to the independent variable (x) is called
(Multiple Choice)
4.8/5 (30)
If the coefficient of determination is a positive value, then the coefficient of correlation
(Multiple Choice)
4.9/5 (30)
The following data show the results of an aptitude test (Y) and the grade point average of 10 students. 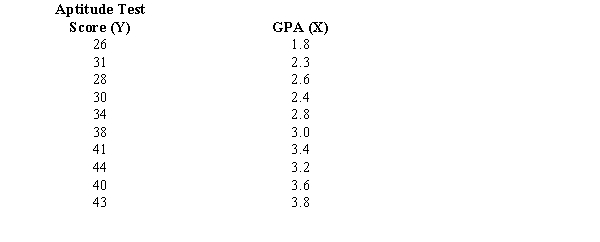 a.Develop a least squares estimated regression line.
b.Compute the coefficient of determination and comment on the strength of the regression relationship.
c.Is the slope significant? Use a t test and let = 0.05.
d.At 95% confidence, test to determine if the model is significant (i.e., perform an F test).
a.Develop a least squares estimated regression line.
b.Compute the coefficient of determination and comment on the strength of the regression relationship.
c.Is the slope significant? Use a t test and let = 0.05.
d.At 95% confidence, test to determine if the model is significant (i.e., perform an F test).
(Essay)
4.9/5 (41)
Exhibit 14-9
A regression and correlation analysis resulted in the following information regarding a dependent variable (y) and an independent variable (x). 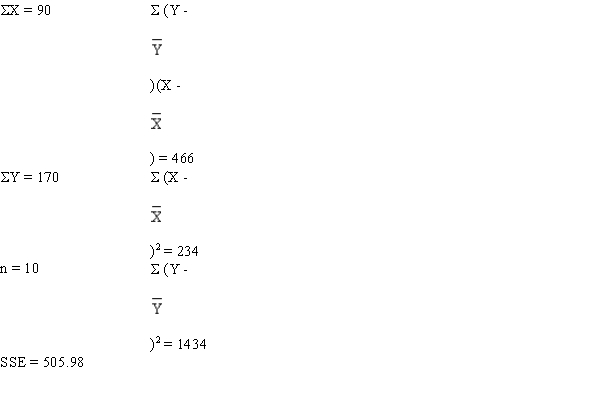 -Refer to Exhibit 14-9. The least squares estimate of b1 equals
(Multiple Choice)
4.8/5 (35)
Assume you have noted the following prices for books and the number of pages that each book contains.  a.Develop a least-squares estimated regression line.
b.Compute the coefficient of determination and explain its meaning.
c.Compute the correlation coefficient between the price and the number of pages. Test to see if x and y are related. Use = 0.10.
a.Develop a least-squares estimated regression line.
b.Compute the coefficient of determination and explain its meaning.
c.Compute the correlation coefficient between the price and the number of pages. Test to see if x and y are related. Use = 0.10.
(Essay)
4.7/5 (37)
Exhibit 14-7
You are given the following information about y and x.  -Refer to Exhibit 14-7. The least squares estimate of b1 (slope) equals
(Multiple Choice)
4.9/5 (32)
Exhibit 14-2
You are given the following information about y and x. 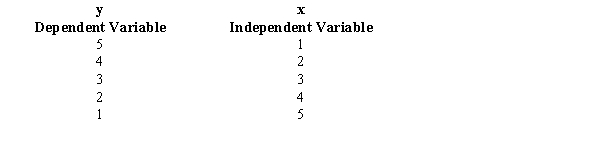 -Refer to Exhibit 14-2. The least squares estimate of b1 (slope) equals
(Multiple Choice)
4.9/5 (33)
Below you are given information on annual income and years of college education. 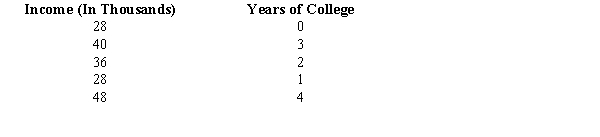 a.Develop the least squares regression equation.
b.Estimate the yearly income of an individual with 6 years of college education.
c.Compute the coefficient of determination.
d.Use a t test to determine whether the slope is significantly different from zero. Let = 0.05.
e.At 95% confidence, perform an F test and determine whether or not the model is significant.
a.Develop the least squares regression equation.
b.Estimate the yearly income of an individual with 6 years of college education.
c.Compute the coefficient of determination.
d.Use a t test to determine whether the slope is significantly different from zero. Let = 0.05.
e.At 95% confidence, perform an F test and determine whether or not the model is significant.
(Essay)
4.8/5 (40)
Exhibit 14-10
The following information regarding a dependent variable Y and an independent variable X is provided. 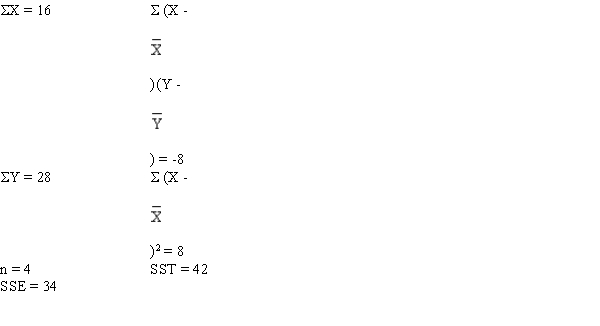 -Refer to Exhibit 14-10. The slope of the regression function is
(Multiple Choice)
4.9/5 (36)
Filters
- Essay(0)
- Multiple Choice(0)
- Short Answer(0)
- True False(0)
- Matching(0)