Exam 14: Simple Linear Regression
Exam 1: Data and Statistics98 Questions
Exam 2: Descriptive Statistics: Tabular and Graphical Displays62 Questions
Exam 3: Descriptive Statistics: Numerical Measures173 Questions
Exam 4: Introduction to Probability138 Questions
Exam 5: Discrete Probability Distributions123 Questions
Exam 6: Continuous Probability Distributions174 Questions
Exam 7: Sampling and Sampling Distributions133 Questions
Exam 8: Interval Estimation137 Questions
Exam 9: Hypothesis Tests148 Questions
Exam 10: Inference About Means and Proportions With Two Populations121 Questions
Exam 11: Inferences About Population Variances90 Questions
Exam 12: Comparing Multiple Proportions, Test of Independence and Goodness of Fit90 Questions
Exam 13: Experimental Design and Analysis of Variance115 Questions
Exam 14: Simple Linear Regression146 Questions
Exam 15: Multiple Regression115 Questions
Exam 16: Regression Analysis: Model Building76 Questions
Exam 17: Time Series Analysis and Forecasting68 Questions
Exam 18: Nonparametric Methods81 Questions
Exam 19: Statistical Methods for Quality Control29 Questions
Exam 20: Index Numbers52 Questions
Exam 21: Decision Analysis on Website65 Questions
Exam 22: Sample Survey on Website63 Questions
Select questions type
Exhibit 14-8
The following information regarding a dependent variable Y and an independent variable X is provided 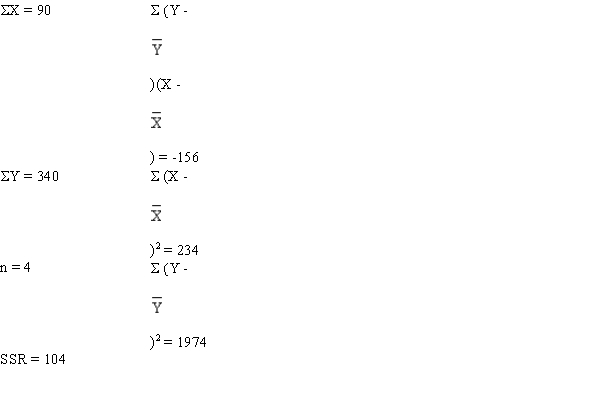 -Refer to Exhibit 14-8. The coefficient of correlation is
(Multiple Choice)
4.7/5  (36)
(36)
Exhibit 14-5
The following information regarding a dependent variable (Y) and an independent variable (X) is provided. 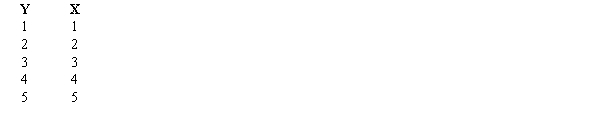 -Refer to Exhibit 14-5. The least squares estimate of the Y intercept is
(Multiple Choice)
4.9/5 (32)
In a regression analysis if SST = 500 and SSE = 300, then the coefficient of determination is
(Multiple Choice)
4.9/5 (34)
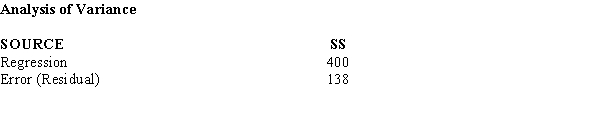
Below you are given a partial computer output based on a sample of 8 observations, relating an independent variable (x) and a dependent variable (y). 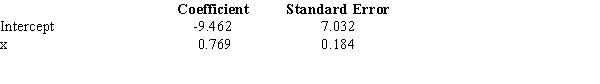
 a.Develop the estimated regression line.
b.At = 0.05, test for the significance of the slope.
c.At = 0.05, perform an F test.
d.Determine the coefficient of determination.
a.Develop the estimated regression line.
b.At = 0.05, test for the significance of the slope.
c.At = 0.05, perform an F test.
d.Determine the coefficient of determination.
(Essay)
4.8/5 (29)
Below you are given a partial computer output based on a sample of 21 observations, relating an independent variable (x) and a dependent variable (y). 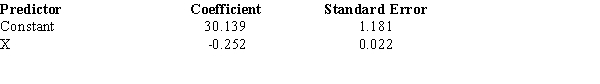
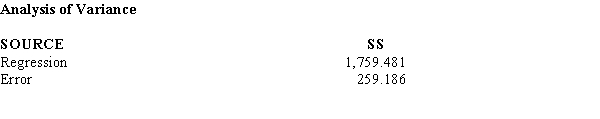 a.Develop the estimated regression line.
b.At = 0.05, test for the significance of the slope.
c.At = 0.05, perform an F test.
d.Determine the coefficient of determination.
e.Determine the coefficient of correlation.
a.Develop the estimated regression line.
b.At = 0.05, test for the significance of the slope.
c.At = 0.05, perform an F test.
d.Determine the coefficient of determination.
e.Determine the coefficient of correlation.
(Essay)
4.9/5 (32)
Compared to the confidence interval estimate for a particular value of y (in a linear regression model), the interval estimate for an average value of y will be
(Multiple Choice)
4.8/5 (45)
Filters
- Essay(0)
- Multiple Choice(0)
- Short Answer(0)
- True False(0)
- Matching(0)