Exam 8: Large-Sample Estimation
Exam 1: Describing Data With Graphs94 Questions
Exam 2: Describing Data With Numerical Measures186 Questions
Exam 3: Describing Bivariate Data35 Questions
Exam 4: Probability and Probability Distributions136 Questions
Exam 5: Several Useful Discrete Distributions129 Questions
Exam 6: The Normal Probability Distribution196 Questions
Exam 7: Sampling Distributions162 Questions
Exam 8: Large-Sample Estimation173 Questions
Exam 9: Large-Sample Tests of Hypotheses210 Questions
Exam 10: Inference From Small Samples261 Questions
Exam 11: The Analysis of Variance156 Questions
Exam 12: Linear Regression and Correlation165 Questions
Exam 13: Multiple Regression Analysis178 Questions
Exam 14: Analysis of Categorical Data136 Questions
Exam 15: Nonparametric Statistics198 Questions
Select questions type
A TV pollster believes that 70% of all TV households would be tuned in to Game 6 of the 1997 NBA Championship series between the Chicago Bulls and the Utah Jazz. A random sample of 500 TV households was selected and 365 indicated they were tuned into the game.
Find a 99% confidence interval for the true proportion of TV households tuned in to the game.
______________
Based on the interval above, can the pollster's claim be rejected?
______________
Explain.
________________________________________________________
(Essay)
4.8/5  (48)
(48)
If you wish to construct 80% lower confidence bound (LCB) for the population mean  , then the z-value you should use is approximately:
(Multiple Choice)
4.9/5 (31)
When constructing a confidence interval for a population parameter, we generally set the confidence coefficient (  ) close to 0 (usually between 0 and 0.05) because it is the probability that the interval does not include the actual value of the population parameter.
(True/False)
4.8/5 (42)
Increasing the confidence coefficient from .90 to .95 and decreasing the sample size from 100 to 50 has unknown impact on the margin of error.
(True/False)
4.8/5 (36)
An Internet server conducted a survey of 400 of its customers and found that the average amount of time spent online was 12.5 hours per week with a standard deviation of 5.4 hours.
What shape do you think the random variable x, the number of hours spent online, has?
______________
If the distribution of the original measurements is not normal, you can still use the standard normal distribution to construct a confidence interval for  , the average online time for all users of this Internet server. Why?
________________________________________________________
Construct a 95% confidence interval for the average online time for all users of the particular Internet server.
______________
If the Internet server claimed that its users averaged 15 hours of use per week, would you agree or disagree?
______________
Explain.
________________________________________________________
, the average online time for all users of this Internet server. Why?
________________________________________________________
Construct a 95% confidence interval for the average online time for all users of the particular Internet server.
______________
If the Internet server claimed that its users averaged 15 hours of use per week, would you agree or disagree?
______________
Explain.
________________________________________________________
(Essay)
4.7/5 (40)
When two independent random samples of sizes  and
and  have been selected from populations with means
  and
and  , and variances
  and
and  , which of the following is true?
(Multiple Choice)
4.9/5 (30)
A 95% lower confidence bound (LCB) for the population mean  can be constructed using the following equation:
LCB =
can be constructed using the following equation:
LCB = 
(True/False)
5.0/5 (45)
In developing a confidence interval estimate for the difference between two population means, an increase in the size of the samples will result in:
(Multiple Choice)
4.9/5 (33)
A process control engineer wishes to estimate the true proportion of defective computer chips with a margin of error of no more than 0.09 and with probability 0.90. How many observations does the engineer need to include in the sample to achieve his goal?
______________
(Short Answer)
4.8/5 (34)
A sample statistic such that the mean of all its possible values differs from the population parameter the statistic seeks to estimate is a biased estimator.
(True/False)
4.9/5 (42)
It is of interest to know if the average time it takes police to reach the scene of an accident differs from that of an ambulance to reach the same accident. Use the summary data listed below where time is in minutes. 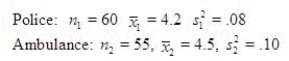 Estimate the difference in the times between the police and the ambulance using a 99% confidence interval.
______________
Does it appear that the times differ?
______________
Estimate the difference in the times between the police and the ambulance using a 99% confidence interval.
______________
Does it appear that the times differ?
______________
(Short Answer)
4.8/5 (27)
As the sample size increases and other factors are the same, the width of a confidence interval for a population mean tends to decrease.
(True/False)
4.7/5 (41)
If a store manager is interested in estimating the mean amount spent per customer per visit at her store, the sample mean  would be the approximate point estimate.
(True/False)
4.7/5 (26)
A study was conducted to see how long Dr. Kennedy's patients had to wait before their appointment. A random sample of 33 patients showed the average waiting time was 22 minutes with a standard deviation of 16 minutes. Construct a 99% confidence interval for  , the true mean waiting time.
______________
, the true mean waiting time.
______________
(Short Answer)
4.9/5 (41)
A manufacturing plant has two assembly lines for producing glass bottles. The plant manager was concerned about whether the proportion of defective bottles differs between the two lines. Two independent random samples were selected and the following summary data computed: 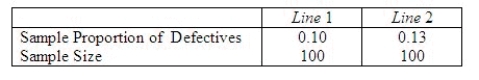 Find a 95% confidence interval for the true difference in proportion of defective bottles produced by the two assembly lines.
______________
Based on the interval above, can one conclude there is a difference in proportion of defective bottles produced by the two lines?
______________
Explain.
________________________________________________________
Find a 95% confidence interval for the true difference in proportion of defective bottles produced by the two assembly lines.
______________
Based on the interval above, can one conclude there is a difference in proportion of defective bottles produced by the two lines?
______________
Explain.
________________________________________________________
(Essay)
4.7/5 (47)
A student government representative at a local university claims that 60% of the undergraduate students favor a move to Division I in college football. A random sample of 250 undergraduate students was selected and 140 students indicated they favored a move to Division I.
Find a 95% confidence interval for the true proportion of undergraduate students who favor the move to Division I.
______________
Based on the interval above, can the representative's claim be rejected?
______________
Explain.
________________________________________________________
(Essay)
4.8/5 (34)
A computer laboratory manager was in charge of purchasing new battery packs for her lab of laptop computers. She narrowed her choices to two models that were available for her machines. Since the two models cost about the same, she was interested in determining whether there was a difference in the average time the battery packs would function before needing to be recharged. She took two independent random samples and computed the following summary information: 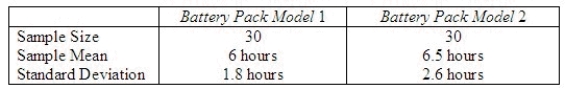 Find a 95% confidence interval for the difference in average functioning time before recharging in the two models.
______________
Based on the interval above, can one conclude there is a difference in the true average functioning time before recharging between the two models of battery packs?
______________
Explain.
________________________________________________________
Find a 95% confidence interval for the difference in average functioning time before recharging in the two models.
______________
Based on the interval above, can one conclude there is a difference in the true average functioning time before recharging between the two models of battery packs?
______________
Explain.
________________________________________________________
(Essay)
5.0/5 (27)
In constructing a confidence interval for a population parameter, such as  or p , the margin of error is directly dependent on the value of the point estimate.
(True/False)
4.8/5 (38)
In the formula:  , the
, the  refers to the area in the lower tail or upper tail of the sampling distribution of the sample mean.
(True/False)
4.8/5 (38)
If you wish to construct 92% lower confidence bound (LCB) for the difference between population means in case of large samples, then the z-value you should use is approximately:
(Multiple Choice)
4.8/5 (35)
Filters
- Essay(0)
- Multiple Choice(0)
- Short Answer(0)
- True False(0)
- Matching(0)