Exam 8: Large-Sample Estimation
Exam 1: Describing Data With Graphs94 Questions
Exam 2: Describing Data With Numerical Measures186 Questions
Exam 3: Describing Bivariate Data35 Questions
Exam 4: Probability and Probability Distributions136 Questions
Exam 5: Several Useful Discrete Distributions129 Questions
Exam 6: The Normal Probability Distribution196 Questions
Exam 7: Sampling Distributions162 Questions
Exam 8: Large-Sample Estimation173 Questions
Exam 9: Large-Sample Tests of Hypotheses210 Questions
Exam 10: Inference From Small Samples261 Questions
Exam 11: The Analysis of Variance156 Questions
Exam 12: Linear Regression and Correlation165 Questions
Exam 13: Multiple Regression Analysis178 Questions
Exam 14: Analysis of Categorical Data136 Questions
Exam 15: Nonparametric Statistics198 Questions
Select questions type
Based on the formula 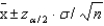 we can assume that the point estimate
  of the population mean
  will be at the center of the confidence interval estimate.
(True/False)
4.8/5  (33)
(33)
A dieter believes that the average number of calories in a homemade peanut butter cookie is more than in a store-bought peanut butter cookie. The summary data are listed below.  Estimate the difference in the mean calories between the two types of cookies using a 90% confidence interval.
______________
Estimate the difference in the mean calories between the two types of cookies using a 90% confidence interval.
______________
(Short Answer)
4.8/5 (33)
A machine produces aluminum tins used in packaging cheese. A random sample of 1000 tins was selected and 43 were found to be defective. Find a 95% upper confidence bound for the true proportion of defective tins produced by the machine.
______________
(Short Answer)
4.9/5 (38)
Instead of paying to support welfare recipients, many Californians want them to find jobs; if necessary, they want the state to create public service jobs for those who cannot find jobs in private industry. In a survey of 800 registered voters, 400 Republicans and 400 Democrats, 75% of the Republicans and 90% of the Democrats favored the creation of public service jobs. Use a large-sample estimation procedure to compare the proportions of Republicans and Democrats who favor creating public service jobs in the population of registered voters in California.
The approximate 95% confidence interval is:
______________
Based on the interval above, is there a difference in the proportion of Republicans and Democrats who favor creating public service jobs in California?
______________
Explain.
________________________________________________________
(Essay)
4.7/5 (45)
If you wish to construct 85% upper confidence bound (UCB) for the population proportion p, then the z-value you should use is approximately:
(Multiple Choice)
4.7/5 (40)
One way to reduce the margin of error in a confidence interval is to decrease the confidence coefficient.
(True/False)
4.9/5 (41)
An airport bus driver conducted a study to see what proportion of customers use the shuttle bus to get to and from the parking lot. The results of his study are listed below, where B = customer used the bus and W = customer walked. 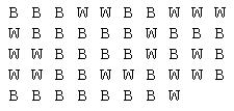 Construct a 95% confidence interval for p, the true proportion of all people who used the bus.
______________
Construct a 90% confidence interval for p, the true proportion of all people who used the bus.
______________
Construct a 95% confidence interval for p, the true proportion of all people who used the bus.
______________
Construct a 90% confidence interval for p, the true proportion of all people who used the bus.
______________
(Short Answer)
4.9/5 (34)
If you wish to construct 98% upper confidence bound (UCB) for the difference between population proportions, then the approximate z-value you should use is:
(Multiple Choice)
4.9/5 (36)
In developing an interval estimate for the population mean  , the population standard deviation
  was assumed to be 6. The interval estimate was 45.0
  1.5. Had
  equaled 12, the interval estimate would be 90
  3.
3.
(True/False)
4.8/5 (37)
An interval estimate is an interval that provides an upper and lower bound for a specific population parameter whose value is unknown.
(True/False)
4.9/5 (38)
The confidence coefficient is the probability that a confidence interval will enclose the estimated parameter.
(True/False)
4.7/5 (40)
The role of the sample mean  in a confidence interval estimate for the population mean
  is to determine:
(Multiple Choice)
4.7/5 (37)
If a 90% confidence interval estimate for the difference between two population proportions is to be constructed, then the confidence coefficient would be:
(Multiple Choice)
4.9/5 (35)
An experiment was conducted to compare two diets A and B designed for weight reduction. Two groups of 50 overweight dieters each were randomly selected. One group was placed on diet A and the other on diet B, and their weight losses were recorded over a 30-day period. The means and standard deviations of the weight-loss measurements for the two groups are shown in the table. 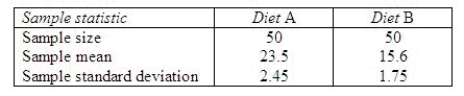 Find a 95% confidence interval for the difference in mean weight loss for the two diets.
______________
Interpret the interval.
________________________________________________________
Find a 95% confidence interval for the difference in mean weight loss for the two diets.
______________
Interpret the interval.
________________________________________________________
(Essay)
5.0/5 (45)
In a study of the relationship between birth order and college success, an investigator found that 140 in a sample of 200 college graduates were firstborn or only children. In a sample of 120 non-graduates of comparable age and socioeconomic background, the number of firstborn or only children was 66. Estimate the difference between the proportions of firstborn or only children in the two populations from which these samples were drawn. Use a 90% confidence interval and interpret your results.
The approximate 90% confidence interval is:
______________
Based on the interval above, is there a difference between the proportions of firstborn or only children in the two populations?
______________
Explain.
________________________________________________________
(Essay)
4.9/5 (39)
If the population variance is increased and other factors are the same, the width of a confidence interval for the population mean tends to increase.
(True/False)
4.9/5 (32)
Assume that two independent random samples of sizes  and
and  have been selected from binomial populations with parameters
  and
and  , respectively. The sampling distribution of
  , the difference between sample proportions, can be approximated by a normal distribution provided that
 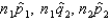 , and
, and  are all greater than 5.
(True/False)
4.7/5 (33)
Filters
- Essay(0)
- Multiple Choice(0)
- Short Answer(0)
- True False(0)
- Matching(0)