Exam 8: Large-Sample Estimation
Exam 1: Describing Data With Graphs94 Questions
Exam 2: Describing Data With Numerical Measures186 Questions
Exam 3: Describing Bivariate Data35 Questions
Exam 4: Probability and Probability Distributions136 Questions
Exam 5: Several Useful Discrete Distributions129 Questions
Exam 6: The Normal Probability Distribution196 Questions
Exam 7: Sampling Distributions162 Questions
Exam 8: Large-Sample Estimation173 Questions
Exam 9: Large-Sample Tests of Hypotheses210 Questions
Exam 10: Inference From Small Samples261 Questions
Exam 11: The Analysis of Variance156 Questions
Exam 12: Linear Regression and Correlation165 Questions
Exam 13: Multiple Regression Analysis178 Questions
Exam 14: Analysis of Categorical Data136 Questions
Exam 15: Nonparametric Statistics198 Questions
Select questions type
A 90% upper confidence bound (UCB) for the population proportion p can be constructed using the following equation:
UCB = 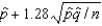
(True/False)
5.0/5  (40)
(40)
The two limits that define an interval estimate are known as confidence limits.
(True/False)
4.9/5 (40)
A 90% confidence interval estimate for a population mean  is determined to be 62.8 to 73.4. If the confidence level is reduced to 80%, the confidence interval for
  becomes narrower.
(True/False)
4.8/5 (40)
The concept of margin of error applies directly when estimating the population mean  , but is not applicable when estimating the population proportion p.
(True/False)
4.8/5 (41)
A stylist at The Hair Care Palace gathered data on the number of hair colorings given on Saturdays and on weekdays. Her results are listed below. Assume the two samples were independently taken from normal populations. 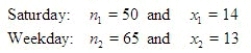 Find the point estimate of p1 - p2.
______________
Find the margin of error.
______________
Estimate the difference in the true proportions with a 99% confidence interval.
______________
Interpret this interval.
________________________________________________________
Find the point estimate of p1 - p2.
______________
Find the margin of error.
______________
Estimate the difference in the true proportions with a 99% confidence interval.
______________
Interpret this interval.
________________________________________________________
(Essay)
4.7/5 (45)
In developing an interval estimate for a population mean, the population standard deviation  was 8. The interval estimate was 40.52
  3.24. Had
  equaled 16, the interval estimate would be:
(Multiple Choice)
4.9/5 (37)
Suppose that a 95% confidence interval for the population proportion p is given by  . This notation means that we are 95% confident that p falls between
  and
and  .
.
(True/False)
4.9/5 (37)
Those who engage in estimation insist on random sampling, rather than convenience sampling or judgment sampling, because random sampling:
(Multiple Choice)
4.7/5 (38)
For a given sample size and given confidence coefficient, the closer the population proportion p to 1.0, the greater the margin of error will be.
(True/False)
4.8/5 (39)
A study was conducted to compare the mean numbers of police emergency calls per 8-hour shift in two districts of Los Angeles. Samples of 100 8-shifts were randomly selected from the police records for each of the two regions, and the number of emergency calls was recorded for each shift. The sample statistics are listed below: 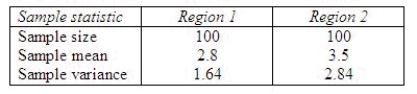 Find a 90% confidence interval for the difference in the mean numbers of police emergency calls per shift between the two districts of the city.
______________
Interpret the interval.
________________________________________________________
Find a 90% confidence interval for the difference in the mean numbers of police emergency calls per shift between the two districts of the city.
______________
Interpret the interval.
________________________________________________________
(Essay)
4.8/5 (43)
A random sample of n = 50 observations from a quantitative population produced  = 65.4 and s2 = 2.8.
Give the best point estimate for the population mean,
= 65.4 and s2 = 2.8.
Give the best point estimate for the population mean,  .
______________
Calculate the margin of error.
______________
.
______________
Calculate the margin of error.
______________
(Short Answer)
4.8/5 (38)
The manufacturer of a particular battery pack for a laptop computer claims the battery pack can function for 8 hours, on the average, before having to be recharged. A random sample of 36 such battery packs was selected and tested. The mean and standard deviation were found to be 6 hours and 1.8 hours, respectively.
Find a 95% lower confidence bound for the true average time the battery pack can function before having to be recharged.
______________
(Short Answer)
4.8/5 (35)
Suppose a 95% confidence interval for the mean height of a 12-year-old male in the United States is 54 to 65 inches. In repeated sampling, 95% of the intervals constructed will contain the interval from 54 to 65 inches.
(True/False)
4.8/5 (38)
The wider the confidence interval, the more likely it is that the interval contains the true value of the population parameter.
(True/False)
4.9/5 (44)
A statistic is said to be unbiased if its sampling distribution has the smallest standard error.
(True/False)
4.8/5 (42)
A recent survey indicates that the proportion of season ticket holders for Ferris State University hockey team that renew their seats is about .80. Using this information, the sample size that is needed to estimate the true proportion that plan to renew their seats using 95% confidence and a margin of error of  .025 is about:
(Multiple Choice)
4.9/5 (39)
A proportion of a college basketball team's season ticket holders renew their tickets for the next season. Let p denote the true proportion of ticket holders who buy tickets again for the following season. A random sample of 125 ticket holders revealed 90 people plan on renewing their tickets. Give a point estimate for p and find the estimated margin of error.
The point estimate is: ______________
The margin of error is: ______________
(Short Answer)
4.9/5 (42)
A 90% confidence interval for the population mean  is found to be between 5.28 and 6.72. Based on this information, the sample mean
  that generated the confidence interval was 6.
(True/False)
4.9/5 (41)
Filters
- Essay(0)
- Multiple Choice(0)
- Short Answer(0)
- True False(0)
- Matching(0)