Exam 2: Tabular and Graphical Methods
Exam 1: Statistics and Data68 Questions
Exam 2: Tabular and Graphical Methods99 Questions
Exam 3: Numerical Descriptive Measures123 Questions
Exam 4: Basic Probability Concepts107 Questions
Exam 5: Discrete Probability Distributions118 Questions
Exam 6: Continuous Probability Distributions114 Questions
Exam 7: Sampling and Sampling Distributions110 Questions
Exam 8: Interval Estimation111 Questions
Exam 9: Hypothesis Testing111 Questions
Exam 10: Statistical Inference Concerning Two Populations104 Questions
Exam 11: Statistical Inference Concerning Variance96 Questions
Exam 12: Chi-Square Tests100 Questions
Exam 13: Analysis of Variance89 Questions
Exam 14: Regression Analysis116 Questions
Exam 15: Inference With Regression Models117 Questions
Exam 16: Regression Models for Nonlinear Relationships95 Questions
Exam 17: Regression Models With Dummy Variables117 Questions
Exam 18: Time Series and Forecasting103 Questions
Exam 19: Returns, Index Numbers and Inflation98 Questions
Exam 20: Nonparametric Tests99 Questions
Select questions type
The accompanying table shows students' scores from the final exam in a history course. 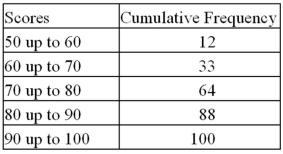 How many of the students scored at least 70 but less than 90?
(Multiple Choice)
4.9/5  (36)
(36)
Exhibit 2-8.Consider the following frequency distribution. 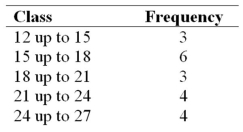 Refer to Exhibit 2-8.How many observations are less than 21?
(Multiple Choice)
4.7/5 (34)
Frequency distributions may be used to describe which of the following types of data?
(Multiple Choice)
4.8/5 (37)
The percent frequency of a category equals the frequency of the category multiplied by 100%.
(True/False)
4.8/5 (35)
When displaying quantitative data,what is an ogive used to plot?
(Multiple Choice)
4.8/5 (47)
Exhibit 2-7.Thirty students at Eastside High School took the SAT on the same Saturday.Their raw scores are given next. 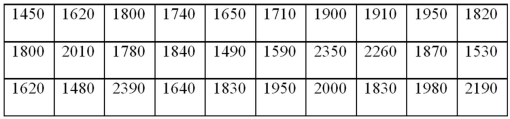 Refer to Exhibit 2-7.Consider a frequency distribution of the data that groups the data in classes of 1400 up to 1600,1600 up to 1800,1800 up to 2000,and so on.How many students scored at least 1800 but less than 2000?
(Multiple Choice)
4.9/5 (29)
For quantitative data,a cumulative frequency distribution records the number of observations that fall below the upper limit of each class.
(True/False)
4.9/5 (33)
A frequency distribution for qualitative data groups this data into classes called intervals and records the total number of observations in each class.
(True/False)
4.8/5 (38)
Construct a stem-and-leaf diagram with the following data set: 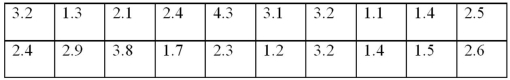 Is the distribution symmetric?
(Essay)
4.9/5 (36)
Exhibit 2-9.An analyst constructed the following frequency distribution on the monthly returns for 50 selected stocks: 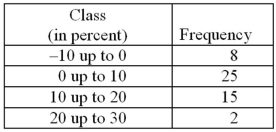 Refer to Exhibit 2-9.The number of stocks with returns of less than 10% is _____.
(Multiple Choice)
4.8/5 (33)
Exhibit 2-14.In the accompanying stem-and-leaf diagram,the values in the stem and leaf portions represent 10s and 1s digits,respectively. 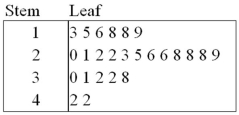 Refer to Exhibit 2-14.Find the frequency associated with data values that are more than 28.
(Multiple Choice)
4.8/5 (28)
Exhibit 2-10.Automobiles traveling on a road with a posted speed limit of 65 miles per hour are checked for speed by a state police radar system.The following table is a frequency distribution of speeds. 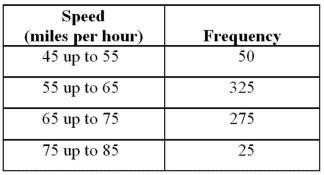 Refer to Exhibit 2-10.When using a polygon to graph quantitative data,what does each point represent?
(Multiple Choice)
4.9/5 (32)
Exhibit 2-3.A city in California spent six million dollars repairing damage to its public buildings in 2010.The following table shows the categories where the money was directed. 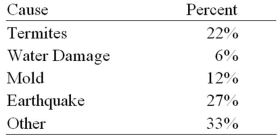 Refer to Exhibit 2-3.How much more did the city spend to fix damage caused by termites compared to the damage caused by water?
(Multiple Choice)
4.8/5 (28)
Exhibit 2-7.Thirty students at Eastside High School took the SAT on the same Saturday.Their raw scores are given next.  Refer to Exhibit 2-7.Consider a frequency distribution of the data that groups the data in classes of 1400 up to 1600,1600 up to 1800,1800 up to 2000,and so on.What is the approximate relative frequency of students who scored more than 1600 but less than 1800?
(Multiple Choice)
4.8/5 (34)
When constructing a frequency distribution for quantitative data,it is important to remember that ____________.
(Multiple Choice)
5.0/5 (45)
The accompanying cumulative relative frequency distribution shows a summary of the scores from an Algebra II exam at a local high school.Twenty students took the exam. 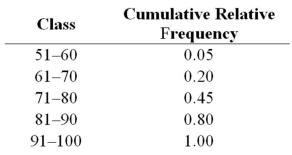 a.Construct the relative frequency distribution.What proportion of students scored between 81 and 90?
B)Construct the frequency distribution.How many students scored between 71 and 80?
C)Construct an ogive.What is the approximate percentage of students that scored less than 85?
a.Construct the relative frequency distribution.What proportion of students scored between 81 and 90?
B)Construct the frequency distribution.How many students scored between 71 and 80?
C)Construct an ogive.What is the approximate percentage of students that scored less than 85?
(Essay)
4.9/5 (33)
Exhibit 2-1.An auto parts chain asked customers to complete a survey rating the chain's customer service as average,above average,or below average.The following shows the results from the survey: 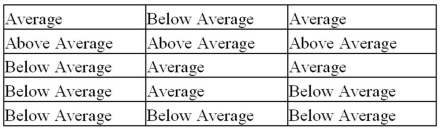 Refer to Exhibit 2-1.The proportion of customers that felt the customer service was average is closest to ______.
(Multiple Choice)
4.9/5 (29)
Exhibit 2-13.The organization of the Girl Sprouts has completed its annual cookie drive.The sales are reported in the accompanying ogive. 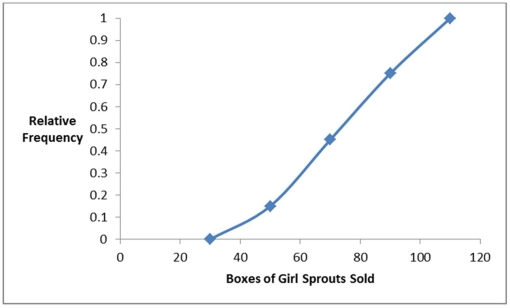 Refer to Exhibit 2-13.Approximate the percentage of girls who sold more than 70 boxes of cookies.
(Multiple Choice)
4.9/5 (40)
Use the following data to construct a scatterplot.What type of relationship is implied? 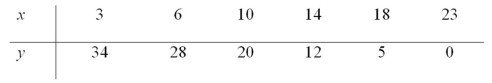
(Multiple Choice)
4.8/5 (40)
Filters
- Essay(0)
- Multiple Choice(0)
- Short Answer(0)
- True False(0)
- Matching(0)