Exam 2: Tabular and Graphical Methods
Exam 1: Statistics and Data68 Questions
Exam 2: Tabular and Graphical Methods99 Questions
Exam 3: Numerical Descriptive Measures123 Questions
Exam 4: Basic Probability Concepts107 Questions
Exam 5: Discrete Probability Distributions118 Questions
Exam 6: Continuous Probability Distributions114 Questions
Exam 7: Sampling and Sampling Distributions110 Questions
Exam 8: Interval Estimation111 Questions
Exam 9: Hypothesis Testing111 Questions
Exam 10: Statistical Inference Concerning Two Populations104 Questions
Exam 11: Statistical Inference Concerning Variance96 Questions
Exam 12: Chi-Square Tests100 Questions
Exam 13: Analysis of Variance89 Questions
Exam 14: Regression Analysis116 Questions
Exam 15: Inference With Regression Models117 Questions
Exam 16: Regression Models for Nonlinear Relationships95 Questions
Exam 17: Regression Models With Dummy Variables117 Questions
Exam 18: Time Series and Forecasting103 Questions
Exam 19: Returns, Index Numbers and Inflation98 Questions
Exam 20: Nonparametric Tests99 Questions
Select questions type
Exhibit 2-4.Students in Professor Smith's Business Statistics course have evaluated the overall effectiveness of the professor's instruction on a five-point scale,where a score of 1 indicates very poor performance and a score of 5 indicates outstanding performance.The raw scores are displayed in the accompanying table: 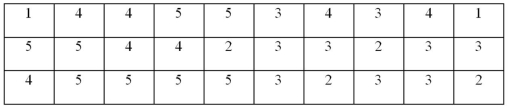 Refer to Exhibit 2-4.What is the most common score given in the evaluations?
(Multiple Choice)
5.0/5  (42)
(42)
The following stem-and-leaf diagram shows the speeds in miles per hour (mph)of 14 cars approaching a toll booth on a bridge in Oakland,California. 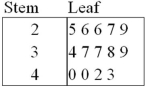 How many of the cars were traveling faster than 25 mph but slower than 40 mph?
(Multiple Choice)
4.8/5 (31)
Exhibit 2-5.The following data represent scores on a pop quiz in a statistics section: 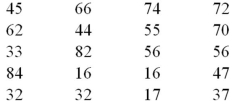 Refer to Exhibit 2-5.Suppose the data is grouped into five classes,and one of them will be "30 up to 44"-that is,{x;30 ≤ x < 44}.The relative frequency of this class is ____.
(Multiple Choice)
4.9/5 (36)
A stem-and-leaf diagram is constructed by separating each value of a data set into two parts.What are these parts?
(Multiple Choice)
4.8/5 (42)
Exhibit 2-11.The accompanying relative frequency distribution represents the last year car sales for the sales force at Kelly's Mega Used Car Center. 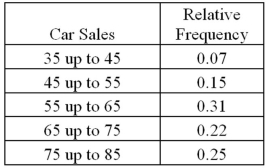 Refer to Exhibit 2-11.If Kelly's employs 100 salespeople,how many of these salespeople have sold at least 45 but less than 65 cars in the last year?
(Multiple Choice)
4.8/5 (34)
A high school football league recorded the average points scored per game,as well as the winning percentage for the 10 teams in the league. 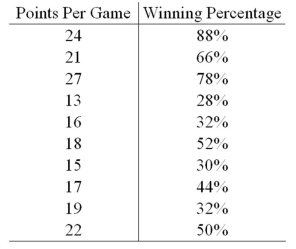 Construct a scatterplot.Does scoring more points appear to be associated with a higher winning percentage?
(Essay)
4.9/5 (33)
A car dealership created a scatterplot showing the manufacturer's retail price and profit margin for the cars they have on their lot. 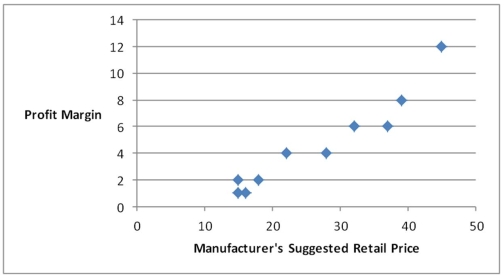 As the manufacturer's suggested retail price increases,the profit margin tends to…
(Multiple Choice)
4.9/5 (34)
Exhibit 2-8.Consider the following frequency distribution. 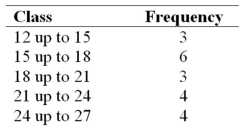 Refer to Exhibit 2-8.How many observations are at least 15 but less than 18?
(Multiple Choice)
4.9/5 (39)
The following data represent the ages of patients in the cardiac section of the local hospital.Construct a stem-and-leaf diagram.Comment on whether or not the distribution is symmetric.
48,53,60,61,62,63,70,70,72,77,78,79,80,82,87,88,90
(Essay)
4.8/5 (35)
Johnson and Johnson (JNJ)is a consumer staples company.Consumer staples are products people need and buy even during times of financial hardship.Do you think JNJ will have a volatile stock price? Does the accompanying graph accurately depict the volatility of JNJ stock? Explain. 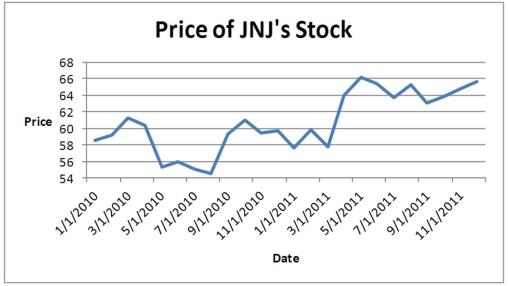
(Essay)
4.8/5 (35)
For both qualitative and quantitative data,what is the difference between the relative frequency and the percent frequency?
(Multiple Choice)
4.7/5 (35)
The dividend yields of the stocks in an investor's portfolio are shown in the following cumulative relative frequency distribution. 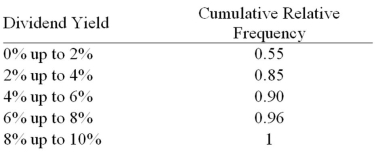 a.Construct an ogive.
B)Approximately what percent of the stocks had a dividend yield of 3% or larger?
a.Construct an ogive.
B)Approximately what percent of the stocks had a dividend yield of 3% or larger?
(Essay)
4.8/5 (44)
For quantitative data,a cumulative relative frequency distribution records the proportion (fraction)of values that fall below the upper limit of each class.
(True/False)
4.9/5 (46)
The following stem-and-leaf diagram shows the last 20 dividend payments (in cents)paid by Proctor and Gamble. 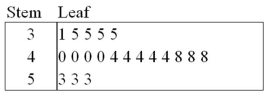 The most common dividend payment is ____.
(Multiple Choice)
4.7/5 (27)
Exhibit 2-10.Automobiles traveling on a road with a posted speed limit of 65 miles per hour are checked for speed by a state police radar system.The following table is a frequency distribution of speeds. 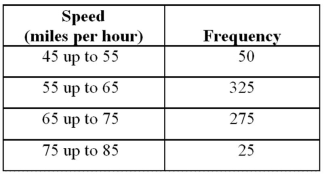 Refer to Exhibit 2-10.How many of the cars traveled less than 75 miles per hour?
(Multiple Choice)
4.8/5 (29)
Exhibit 2-9.An analyst constructed the following frequency distribution on the monthly returns for 50 selected stocks: 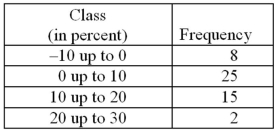 Refer to Exhibit 2-9.The proportion of stocks with returns of less than 10% is ____.
(Multiple Choice)
4.8/5 (18)
Exhibit 2-7.Thirty students at Eastside High School took the SAT on the same Saturday.Their raw scores are given next. 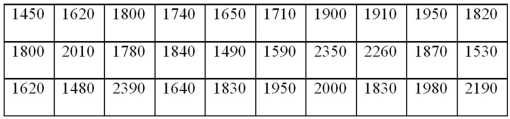 Refer to Exhibit 2-7.Consider a frequency distribution of the data that groups the data in classes of 1400 up to 1600,1600 up to 1800,1800 up to 2000,and so on.What percent of students scored less than 2200?
(Multiple Choice)
4.9/5 (37)
The relative frequency of a category is calculated by dividing the category's frequency by the total number of observations.
(True/False)
4.8/5 (32)
Exhibit 2-6.The following data represent the recent sales price (in $1,000s)of 24 homes in a Midwestern city. 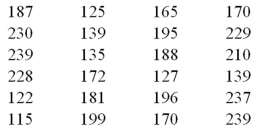 Refer to Exhibit 2-6.Suppose the data is grouped into five classes,and one of them will be "165 up to 190"- that is,{x;165 ≤ x < 190}.The frequency of this class is ____.
(Multiple Choice)
4.9/5 (34)
Filters
- Essay(0)
- Multiple Choice(0)
- Short Answer(0)
- True False(0)
- Matching(0)