Exam 2: Tabular and Graphical Methods
Exam 1: Statistics and Data68 Questions
Exam 2: Tabular and Graphical Methods99 Questions
Exam 3: Numerical Descriptive Measures123 Questions
Exam 4: Basic Probability Concepts107 Questions
Exam 5: Discrete Probability Distributions118 Questions
Exam 6: Continuous Probability Distributions114 Questions
Exam 7: Sampling and Sampling Distributions110 Questions
Exam 8: Interval Estimation111 Questions
Exam 9: Hypothesis Testing111 Questions
Exam 10: Statistical Inference Concerning Two Populations104 Questions
Exam 11: Statistical Inference Concerning Variance96 Questions
Exam 12: Chi-Square Tests100 Questions
Exam 13: Analysis of Variance89 Questions
Exam 14: Regression Analysis116 Questions
Exam 15: Inference With Regression Models117 Questions
Exam 16: Regression Models for Nonlinear Relationships95 Questions
Exam 17: Regression Models With Dummy Variables117 Questions
Exam 18: Time Series and Forecasting103 Questions
Exam 19: Returns, Index Numbers and Inflation98 Questions
Exam 20: Nonparametric Tests99 Questions
Select questions type
Exhibit 2-4.Students in Professor Smith's Business Statistics course have evaluated the overall effectiveness of the professor's instruction on a five-point scale,where a score of 1 indicates very poor performance and a score of 5 indicates outstanding performance.The raw scores are displayed in the accompanying table: 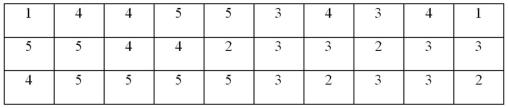 Refer to Exhibit 2-4.What is the relative frequency of the students who gave Professor Smith an evaluation of 3?
(Multiple Choice)
4.9/5  (37)
(37)
Exhibit 2-11.The accompanying relative frequency distribution represents the last year car sales for the sales force at Kelly's Mega Used Car Center. 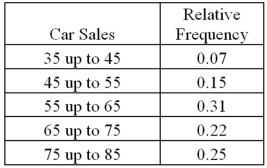 Refer to Exhibit 2-11.If Kelly's employs 100 salespeople,how many of these salespeople have sold at least 35 but less than 45 cars in the last year?
(Multiple Choice)
4.8/5 (32)
Exhibit 2-10.Automobiles traveling on a road with a posted speed limit of 65 miles per hour are checked for speed by a state police radar system.The following table is a frequency distribution of speeds. 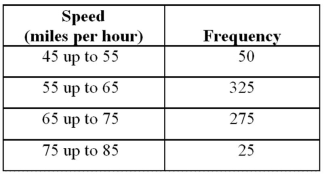 Refer to Exhibit 2-10.What proportion of the cars traveled at least 55 but less than 65 miles per hour?
(Multiple Choice)
4.9/5 (36)
Exhibit 2-7.Thirty students at Eastside High School took the SAT on the same Saturday.Their raw scores are given next. 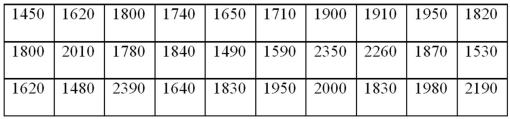 Refer to Exhibit 2-7.Consider a frequency distribution of the data that groups the data in classes of 1400 up to 1600,1600 up to 1800,1800 up to 2000,and so on.What graphical tool would you use to display the cumulative relative frequency of the grouped data?
(Multiple Choice)
4.8/5 (33)
A scatterplot is a graphical tool that helps determine whether or not two quantitative variables are related.
(True/False)
4.9/5 (32)
The following table shows analyst sentiment ratings for the 30 stocks listed in the Dow Jones Industrial Average.
(Essay)
4.8/5 (28)
Exhibit 2-14.In the accompanying stem-and-leaf diagram,the values in the stem and leaf portions represent 10s and 1s digits,respectively.  Refer to Exhibit 2-14.How many values are at least 25 but less than 35?
(Multiple Choice)
4.8/5 (39)
Exhibit 2-6.The following data represent the recent sales price (in $1,000s)of 24 homes in a Midwestern city. 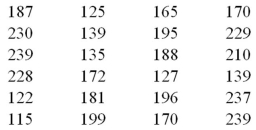 Refer to Exhibit 2-6.Suppose the data on house prices will be grouped into five classes.The width of the classes for a frequency distribution or histogram is closest to ______.
(Multiple Choice)
4.8/5 (43)
Exhibit 2-2.The following is a list of five of the world's busiest airports by passenger traffic for 2010. 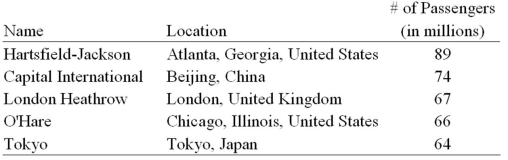 Refer to Exhibit 2-2.How many more millions of passengers flew out of Atlanta than flew out of Chicago?
(Multiple Choice)
4.8/5 (28)
The following histogram represents the number of pages in each book within a collection.What is the frequency of books containing at least 200 but less than 250 pages? 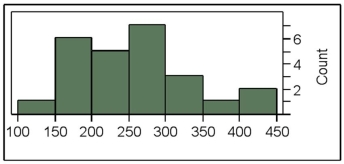
(Multiple Choice)
4.8/5 (40)
The following histogram represents the number of pages in each book within a collection.What is the frequency of books containing at least 250 but less than 400 pages? 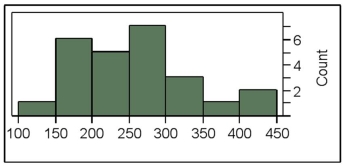
(Multiple Choice)
4.9/5 (40)
Exhibit 2-14.In the accompanying stem-and-leaf diagram,the values in the stem and leaf portions represent 10s and 1s digits,respectively. 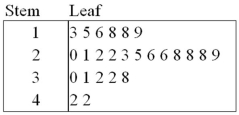 Refer to Exhibit 2-14.Which of the following numbers appears in the stem-and-leaf diagram?
(Multiple Choice)
4.8/5 (34)
Exhibit 2-4.Students in Professor Smith's Business Statistics course have evaluated the overall effectiveness of the professor's instruction on a five-point scale,where a score of 1 indicates very poor performance and a score of 5 indicates outstanding performance.The raw scores are displayed in the accompanying table: 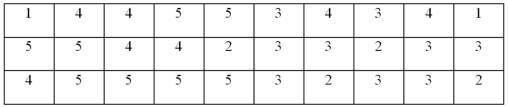 Refer to Exhibit 2-4.What percentage of students gave Professor Smith an evaluation higher than 3?
(Multiple Choice)
5.0/5 (35)
A pie chart is a segmented circle that portrays the categories and relative sizes of some quantitative variable.
(True/False)
4.8/5 (27)
A polygon connects a series of neighboring points where each point represents the midpoint of a particular class and its associated frequency or relative frequency.
(True/False)
4.9/5 (29)
A survey of 400 unemployed people was completed at a job fair.Each person was asked to categorize their job interests.The accompanying relative frequency distribution was constructed. 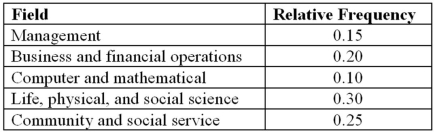 a.Construct the corresponding frequency distribution.How many of these people designated that the computer and mathematical industry was their job interest?
B)Construct a pie chart.
a.Construct the corresponding frequency distribution.How many of these people designated that the computer and mathematical industry was their job interest?
B)Construct a pie chart.
(Essay)
4.9/5 (29)
Use the following data to construct a scatterplot.What type of relationship is implied? 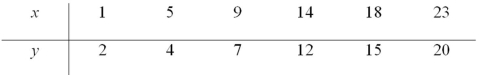
(Multiple Choice)
4.8/5 (45)
Exhibit 2-6.The following data represent the recent sales price (in $1,000s)of 24 homes in a Midwestern city.  Refer to Exhibit 2-6.Suppose the data is grouped into five classes,and one of them will be "115 up to 140"- that is,{x;115 ≤ x < 140}.The relative frequency of this class is _____.
(Multiple Choice)
4.8/5 (37)
Filters
- Essay(0)
- Multiple Choice(0)
- Short Answer(0)
- True False(0)
- Matching(0)