Exam 4: Process Analysis
Exam 1: Using Operations to Compete107 Questions
Exam 2: Project Management151 Questions
Exam 3: Process Strategy149 Questions
Exam 4: Process Analysis192 Questions
Exam 5: Quality and Performance223 Questions
Exam 6: Capacity Planning133 Questions
Exam 7: Constraint Management160 Questions
Exam 8: Lean Systems179 Questions
Exam 9: Supply Chain Inventory Management216 Questions
Exam 10: Supply Chain Design93 Questions
Exam 11: Supply Chain Location Decisions126 Questions
Exam 12: Supply Chain Integration130 Questions
Exam 13: Supply Chain Sustainability and Humanitarian Logistics77 Questions
Exam 14: Forecasting183 Questions
Exam 15: Operations Planning and Scheduling191 Questions
Exam 16: Resource Planning149 Questions
Exam 17: Decision Making118 Questions
Exam 18: Waiting Line127 Questions
Exam 19: Special Inventory Models53 Questions
Exam 20: Linear Programming84 Questions
Exam 21: Simulation61 Questions
Exam 22: Financial Analysis60 Questions
Exam 23: Acceptance Sampling Plans88 Questions
Exam 24: Measuring Output Rates103 Questions
Exam 25: Learning Curve Analysis56 Questions
Exam 26: Operations Scheduling131 Questions
Select questions type
The step in process analysis that immediately follows the performance evaluation phase is the:
(Multiple Choice)
4.8/5  (33)
(33)
An effective tool for showing steps of a service process with a high level of customer contact is a:
(Multiple Choice)
4.7/5 (36)
A learning curve is a line showing the relationship between processing time and the cumulative quantity of a product or service produced.
(True/False)
4.9/5 (36)
Scenario 4.1
Garman observes a worker assembling peanut valves and records the data displayed in the table.
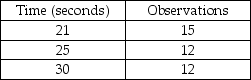 -Use the information in Scenario 4.1.What is the average time for this job element?
(Multiple Choice)
4.7/5 (37)
The first unit of production takes 12 hours to produce and the learning rate is expected to be 80 percent.How long will it take to produce the sixth unit?
(Multiple Choice)
4.9/5 (30)
The first unit of production takes 20 hours to produce and the learning rate is expected to be 90 percent.How long will it take to produce the fourth unit?
(Multiple Choice)
4.9/5 (41)
A welder can weld 2 angle irons together in 2 minutes.Over the course of an entire year she will assemble 1,000 units,each of which requires 3 such welds (i.e. ,welding two angle irons together is one step,and three such steps are needed per unit).If she is paid $25 an hour,how much is her annual welding labor cost?
(Multiple Choice)
4.9/5 (27)
A histogram is a summarization of data measured on a yes-or-no basis.
(True/False)
4.9/5 (33)
Scenario 4.4
A job consists of three elements.Twenty observations for each element were timed,and the resulting data are shown in the following table.A performance rating has also been assigned for each element,as shown in the table.The job has an allowance of 20% of normal time.
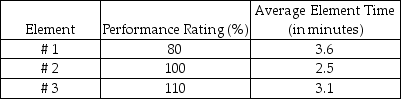 -Use the information in Scenario 4.4.What is the normal time for job element #3?
(Multiple Choice)
4.9/5 (41)
An eighty percent learning curve means that for each doubling of output,the time required to complete the last task is ________ percent less than before.
(Essay)
4.8/5 (36)
An employee suggestion system can be an effective method for identifying processes that need improvement.
(True/False)
4.9/5 (43)
A voluntary system by which employees submit their ideas on process improvements is called a(n)________.
(Essay)
4.8/5 (33)
Which one of the following statements concerning flowcharts is NOT true?
(Multiple Choice)
4.9/5 (38)
An examination of strategic issues such as possible gaps between a process's competitive priorities and current competitive capabilities falls in the:
(Multiple Choice)
4.7/5 (29)
A group of people,who are knowledgeable about the process and its disconnects,meets to propose ideas for change in a rapid-fire manner.Such a session is called a brainstorming session.
(True/False)
4.8/5 (30)
The time added to adjust for factors such as fatigue or equipment malfunction is called ________.
(Essay)
4.9/5 (32)
________ are performance measures that are established for a process and the steps within it.
(Essay)
4.9/5 (33)
A voluntary system by which employees submit their ideas on process improvements is used in the:
(Multiple Choice)
4.8/5 (33)
Scenario 4.2
Garman observes a worker assembling peanut valves and records the data displayed in the table.
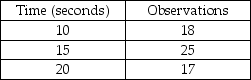 -Use the information in Scenario 4.2.What is the average time for this job element?
(Multiple Choice)
4.9/5 (35)
Filters
- Essay(0)
- Multiple Choice(0)
- Short Answer(0)
- True False(0)
- Matching(0)