Exam 4: Process Analysis
Exam 1: Using Operations to Compete107 Questions
Exam 2: Project Management151 Questions
Exam 3: Process Strategy149 Questions
Exam 4: Process Analysis192 Questions
Exam 5: Quality and Performance223 Questions
Exam 6: Capacity Planning133 Questions
Exam 7: Constraint Management160 Questions
Exam 8: Lean Systems179 Questions
Exam 9: Supply Chain Inventory Management216 Questions
Exam 10: Supply Chain Design93 Questions
Exam 11: Supply Chain Location Decisions126 Questions
Exam 12: Supply Chain Integration130 Questions
Exam 13: Supply Chain Sustainability and Humanitarian Logistics77 Questions
Exam 14: Forecasting183 Questions
Exam 15: Operations Planning and Scheduling191 Questions
Exam 16: Resource Planning149 Questions
Exam 17: Decision Making118 Questions
Exam 18: Waiting Line127 Questions
Exam 19: Special Inventory Models53 Questions
Exam 20: Linear Programming84 Questions
Exam 21: Simulation61 Questions
Exam 22: Financial Analysis60 Questions
Exam 23: Acceptance Sampling Plans88 Questions
Exam 24: Measuring Output Rates103 Questions
Exam 25: Learning Curve Analysis56 Questions
Exam 26: Operations Scheduling131 Questions
Select questions type
A flowchart created at the strategic level of an organization should show:
(Multiple Choice)
4.8/5  (40)
(40)
Which one of the following techniques will help management trace customer complaints directly to the process involved?
(Multiple Choice)
4.9/5 (29)
A process troubleshooter has to decide which problem to address first with his or her cause-and-effect diagram.The data analysis tool that will help him decide which problem to tackle first is a:
(Multiple Choice)
4.8/5 (32)
Because a telephone customer service center has experienced several problems,it has begun to analyze the data from customer complaints.The first step was to construct the following table.Use this data to build a Pareto chart to help identify the "vital few" problems.
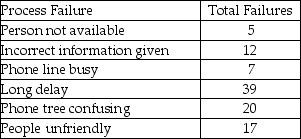
(Essay)
4.8/5 (29)
Scenario 4.2
Garman observes a worker assembling peanut valves and records the data displayed in the table.
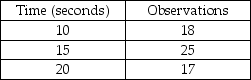 -Use the information in Scenario 4.2.What is the normal time for this job element if the rating factor is 75%?
(Multiple Choice)
4.8/5 (32)
Studying and developing a process improvement plan for a business or other process you are familiar with (e.g. ,fast food restaurant,obtaining tickets to a university-sponsored event,dry cleaners,book purchases for next term,and the like)
(Essay)
4.8/5 (38)
Compare and contrast the method of time study to the method of work sampling.What are the strengths and limitations of each,and for which applications are they best suited?
(Essay)
4.8/5 (31)
Which of the following analyses is best suited for a scatter diagram?
(Multiple Choice)
4.9/5 (34)
The first step of the systematic approach to process analysis is ________.
(Essay)
4.9/5 (35)
A restaurant manager tracks complaints from the diner satisfaction cards that are turned in at each table.The data collected from the past week's diners appear in the following table. 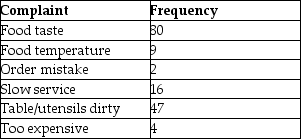 Using a classic Pareto analysis,what are the vital few complaints?
(Multiple Choice)
4.7/5 (40)
Consider the four steps in a time study.If an analyst were to make a mistake,during which step would the impact on the standard time be the greatest? Explain your reasoning.
(Essay)
4.8/5 (32)
A(n)________ means that a department focuses on its own tasks without understanding the role and processes of departments outside its own organizational boundaries.
(Essay)
4.9/5 (38)
A pilot work study has been conducted on a new operation with four work elements.The following times,in seconds,were obtained using a time study. 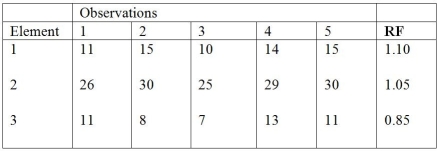 a.What is the normal time for this operation?
b.If an allowance of 20 percent is used,what is the standard time for this task?
a.What is the normal time for this operation?
b.If an allowance of 20 percent is used,what is the standard time for this task?
(Essay)
4.9/5 (32)
The bursar's office at a large state school sends a team to the bookstore on campus to see how they handle customers and process payments.This is an example of functional benchmarking.
(True/False)
4.8/5 (45)
A restaurant manager tracks complaints from the diner satisfaction cards that are turned in at each table.The data collected from the past week's diners appear in the following table. 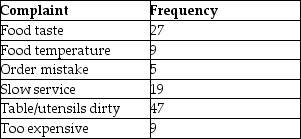 Using a classic Pareto analysis,what categories comprise 80% of the total complaints?
(Multiple Choice)
4.7/5 (31)
Filters
- Essay(0)
- Multiple Choice(0)
- Short Answer(0)
- True False(0)
- Matching(0)