Exam 4: Process Analysis
Exam 1: Using Operations to Compete107 Questions
Exam 2: Project Management151 Questions
Exam 3: Process Strategy149 Questions
Exam 4: Process Analysis192 Questions
Exam 5: Quality and Performance223 Questions
Exam 6: Capacity Planning133 Questions
Exam 7: Constraint Management160 Questions
Exam 8: Lean Systems179 Questions
Exam 9: Supply Chain Inventory Management216 Questions
Exam 10: Supply Chain Design93 Questions
Exam 11: Supply Chain Location Decisions126 Questions
Exam 12: Supply Chain Integration130 Questions
Exam 13: Supply Chain Sustainability and Humanitarian Logistics77 Questions
Exam 14: Forecasting183 Questions
Exam 15: Operations Planning and Scheduling191 Questions
Exam 16: Resource Planning149 Questions
Exam 17: Decision Making118 Questions
Exam 18: Waiting Line127 Questions
Exam 19: Special Inventory Models53 Questions
Exam 20: Linear Programming84 Questions
Exam 21: Simulation61 Questions
Exam 22: Financial Analysis60 Questions
Exam 23: Acceptance Sampling Plans88 Questions
Exam 24: Measuring Output Rates103 Questions
Exam 25: Learning Curve Analysis56 Questions
Exam 26: Operations Scheduling131 Questions
Select questions type
A restaurant manager tracks complaints from the diner satisfaction cards that are turned in at each table.The data collected from the past week's diners appear in the following table. 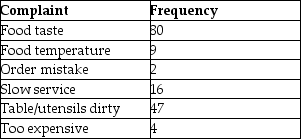 Using a classic Pareto analysis,what categories comprise about 20% of the total complaints?
(Multiple Choice)
4.8/5  (31)
(31)
A great job of flowcharting and benchmarking a process is of only academic interest if the proposed changes are not implemented.
(True/False)
4.9/5 (33)
A(n)________ is a method where a group of people,knowledgeable about the process and its disconnects,propose ideas for change in a rapid-fire manner.
(Essay)
4.8/5 (37)
Scenario 4.3
A job consists of three elements.Twenty observations for each element were timed,and the resulting data are shown in the following table.A performance rating has also been assigned for each element,as shown in the table.The job has an allowance of 15% of normal time.
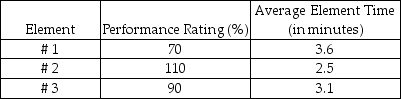 -Use the information in Scenario 4.3.What is the normal time for the entire job?
(Multiple Choice)
4.8/5 (40)
Scenario 4.3
A job consists of three elements.Twenty observations for each element were timed,and the resulting data are shown in the following table.A performance rating has also been assigned for each element,as shown in the table.The job has an allowance of 15% of normal time.
-Use the information in Scenario 4.3.What is the normal time for job element #2?
(Multiple Choice)
4.9/5 (32)
A flowchart traces the flow of ________,________,________,or ________ through the various steps of a process.
(Essay)
4.8/5 (32)
A(n)________ is a bar chart on which the factors are plotted in decreasing order of frequency along the horizontal axis.
(Essay)
4.7/5 (40)
The authors discuss seven mistakes when managing processes,arguing that failure to manage processes is ultimately a failure to manage the business.What are any four of those mistakes?
(Essay)
4.8/5 (38)
A professor can grade a quiz in 2 minutes.Over the course of an academic year he has 6 sections of a course with an average of 25 students with 10 quizzes in each section.If he is paid $40 an hour,how much is his annual quiz-grading labor cost to the university?
(Multiple Choice)
4.9/5 (30)
In a swim lane flowchart,the line of visibility is used to separate the process steps in view of the customer from those hidden from view of the customer.
(True/False)
4.7/5 (36)
A(n)________ is a form used to record the frequency of occurrence of certain product or service characteristics related to quality.
(Essay)
4.8/5 (37)
The first unit of production takes 20 hours to produce and the learning rate is expected to be 90 percent.How long will it take to produce the eighth unit?
(Multiple Choice)
4.8/5 (44)
A(n)________ is a diagram that relates a key quality problem to its potential causes.
(Essay)
4.9/5 (37)
A yes-no decision point in a process is represented in the flowchart by a:
(Multiple Choice)
4.8/5 (29)
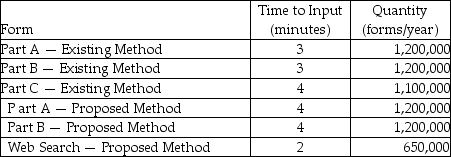
An existing insurance application process requires manual keying of three different forms by a team of data entry operators.The three forms' input times appear in the following table along with the numbers of each type of form anticipated for the coming year.A proposed refinement in the process would reduce the number of forms but make each slightly longer.This would be combined with a search of public records on the World Wide Web as necessary.These times and quantities appear in the lower half of the table.If the labor rate for the data entry operators is the same,which method is preferable?
(Essay)
4.8/5 (30)
Process analysis is the documentation and detailed understanding of how work is performed and how it can be redesigned.
(True/False)
4.8/5 (35)
________ is the documentation and detailed understanding of how work is performed and how it can be redesigned.
(Essay)
4.8/5 (43)
The semester project came back from the copy store and to her horror,the project leader has just noticed that the left side y-axis of a key Pareto chart was cut off due to a printing error.The bar chart component uses the missing left side y-axis and the cumulative percentage line on the Pareto chart uses the right side y-axis.The project leader is pretty sure that the total number of observations in all combined categories is 200.Can you help her develop estimates of the counts for each of the five categories? 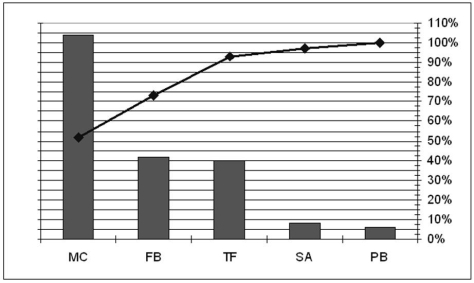
(Essay)
4.9/5 (37)
The first unit of production takes 12 hours to produce and the learning rate is expected to be 80 percent.How long will it take to produce the eighth unit?
(Multiple Choice)
4.7/5 (34)
Work sampling can be used to estimate the proportion of time spent by people or machines on activities.
(True/False)
4.7/5 (37)
Filters
- Essay(0)
- Multiple Choice(0)
- Short Answer(0)
- True False(0)
- Matching(0)