Exam 3: Quality and Performance
Exam 1: Using Operations to Create Value100 Questions
Exam 2: Process Strategy and Analysis245 Questions
Exam 3: Quality and Performance195 Questions
Exam 4: Capacity Planning108 Questions
Exam 5: Constraint Management136 Questions
Exam 6: Lean Systems164 Questions
Exam 7: Project Management140 Questions
Exam 8: Forecasting150 Questions
Exam 9: Inventory Management207 Questions
Exam 10: Operations Planning and Scheduling149 Questions
Exam 11: Resource Planning125 Questions
Exam 12: Supply Chain Design77 Questions
Exam 13: Supply Chain Logistic Networks114 Questions
Exam 14: Supply Chain Integration111 Questions
Exam 15: Supply Chain Sustainability73 Questions
Exam 16: Decision Making107 Questions
Exam 17: Waiting Lines108 Questions
Exam 18: Special Inventory Models53 Questions
Exam 19: Linear Programming86 Questions
Exam 20: Simulation54 Questions
Exam 21: Financial Analysis55 Questions
Exam 22: Acceptance Sampling Plans87 Questions
Exam 23: Measuring Output Rates106 Questions
Exam 24: Learning Curve Analysis51 Questions
Exam 25: Operations Scheduling120 Questions
Exam 26: Layout36 Questions
Select questions type
A manufacturer embarking on a Six Sigma program sets the goal of having true Six Sigma capability for all processes by the end of the month.If their current process capability index on a key metric is less than 2.0 and the process capability ratio is 1.5,what must happen with the process standard deviation?
(Multiple Choice)
4.8/5  (39)
(39)
In acceptance sampling,when the random sample passes the buyer's incoming test (low number of defects found),the next action taken is to:
(Multiple Choice)
4.8/5 (33)
Table 5.3
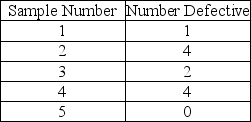 -Use the information from Table 5.3.What is the upper control limit (UCL)if the bank were to use z = 2 and a sample size of 100?
(Multiple Choice)
4.8/5 (41)
The underlying statistical distribution for the p-chart is:
(Multiple Choice)
5.0/5 (38)
The defect rate for a product has historically been about 2.0%.What are the upper and lower control chart limits if you wish to use a sample size of 100 and 3-sigma limits?
(Essay)
4.8/5 (33)
Improving quality seems to be a strategic weapon in gaining market share.However,improving quality entails allocation of resources and effort.As greater effort is expended to stop defects before they occur,which one of the following costs increases?
(Multiple Choice)
5.0/5 (35)
The upper and lower specifications for a service are 10 min.and 8 min. ,respectively.The process average is 9 min.and the process capability ratio is 1.33.What is the process standard deviation?
(Multiple Choice)
5.0/5 (36)
A metal-cutting operation has a target value of 20 and consistently averages 19.8 with a standard deviation of 0.5.The design engineers have established an upper specification limit of 22 and a lower specification limit of 18.Which statement concerning this process is TRUE?
(Multiple Choice)
4.8/5 (35)
Process capability determines whether a process is capable of producing the product or services that customers demand.
(True/False)
4.8/5 (37)
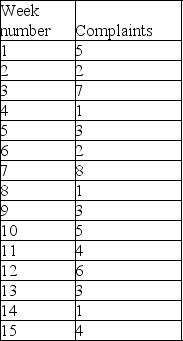
If an x-bar chart is constructed using the data in Table 5.4,what conclusion can be reached?
(Multiple Choice)
4.8/5 (28)
In acceptance sampling,the proportion defective that the buyer will allow in an incoming shipment is:
(Multiple Choice)
4.8/5 (40)
A company is interested in monitoring the average time it takes to serve its customers.An appropriate control chart would be:
(Multiple Choice)
4.8/5 (42)
Regarding control charts,changing from two-sigma limits to three-sigma limits:
(Multiple Choice)
4.8/5 (32)
A professor records the number of students who complain each week throughout the semester.If the class size is forty students,what are 3-sigma control limits for this class? Construct a control chart and interpret the data.
(Essay)
4.9/5 (36)
In acceptance sampling,the ________ is the proportion defective that the buyer will allow in an incoming shipment.
(Essay)
4.9/5 (40)
________ costs arise when a defect is discovered after the customer has received the product or service.
(Essay)
4.8/5 (36)
The process  and R-charts are developed using a sample size of 5,but the technician mistakenly looks up A2,D3,and D4 values for a sample size of 7.If these charts are put into daily use,the manufacturer will mistakenly ship more bad product than had the charts been constructed correctly.
(True/False)
4.9/5 (48)
Among the seven criteria in the Baldrige Performance Excellence Program,which has the greatest weight in scoring?
(Multiple Choice)
4.9/5 (27)
On a control chart,a type I error occurs when the employee concludes that the process is in control when it is actually out of statistical control.
(True/False)
4.8/5 (45)
Filters
- Essay(0)
- Multiple Choice(0)
- Short Answer(0)
- True False(0)
- Matching(0)