Exam 3: Quality and Performance
Exam 1: Using Operations to Create Value100 Questions
Exam 2: Process Strategy and Analysis245 Questions
Exam 3: Quality and Performance195 Questions
Exam 4: Capacity Planning108 Questions
Exam 5: Constraint Management136 Questions
Exam 6: Lean Systems164 Questions
Exam 7: Project Management140 Questions
Exam 8: Forecasting150 Questions
Exam 9: Inventory Management207 Questions
Exam 10: Operations Planning and Scheduling149 Questions
Exam 11: Resource Planning125 Questions
Exam 12: Supply Chain Design77 Questions
Exam 13: Supply Chain Logistic Networks114 Questions
Exam 14: Supply Chain Integration111 Questions
Exam 15: Supply Chain Sustainability73 Questions
Exam 16: Decision Making107 Questions
Exam 17: Waiting Lines108 Questions
Exam 18: Special Inventory Models53 Questions
Exam 19: Linear Programming86 Questions
Exam 20: Simulation54 Questions
Exam 21: Financial Analysis55 Questions
Exam 22: Acceptance Sampling Plans87 Questions
Exam 23: Measuring Output Rates106 Questions
Exam 24: Learning Curve Analysis51 Questions
Exam 25: Operations Scheduling120 Questions
Exam 26: Layout36 Questions
Select questions type
Historically,the average proportion of defective bars has been 0.015.Samples will be of 100 bars each.Construct a p-chart using z = 3.What is the value of LCL?
(Multiple Choice)
4.9/5  (39)
(39)
________ is the international standard governing environmental management.
(Essay)
4.8/5 (36)
A laser surgery process has tolerances of plus or minus .01 inches.What does the process standard deviation need to be in order for this process to have a capability ratio of 1.00?
(Multiple Choice)
4.7/5 (33)
Construct a 3-sigma  and R-chart for the length in centimeters of a part from the following table.
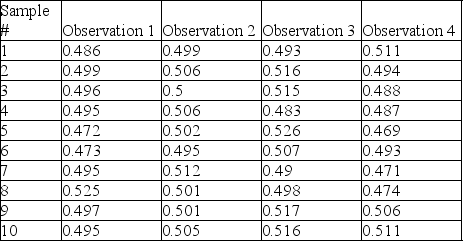
(Essay)
5.0/5 (27)
Table 5.4
The manager of Champion Cooling Company has recently implemented a statistical process control method.The accompanying table shows the results of five different samples of walk-in coolers that were produced in the previous month.
 -Use the information in Table 5.4.The center line of the R-chart is:
(Multiple Choice)
4.8/5 (37)
Increasing the quality level by better products and processes may:
(Multiple Choice)
4.8/5 (31)
The defect rate for a product has historically been about 5.0%.What is the upper control chart limit if you wish to use a sample size of 50 and 3-sigma limits?
(Multiple Choice)
4.9/5 (41)
Financial and market results are one consideration of the Baldrige Performance Excellence Program.
(True/False)
4.9/5 (47)
The Baldrige Performance Excellence Program considers a company's business results but ISO 9001:2008 registration does not.
(True/False)
4.9/5 (39)
The poultry farmer was aghast when the grocery store revealed their new weapon in the war on poor quality.They planned to use a(n)________ to monitor the rotten eggs found in the cartons of farm fresh free range eggs that he supplied.The poultry farmer was well-versed in quality and knew their choice to be the right one;nevertheless he was upset about this level of scrutiny and what he perceived as a lack of trust.
(Essay)
4.8/5 (39)
Regarding control charts,changing from three-sigma limits to two-sigma limits:
(Multiple Choice)
4.8/5 (38)
A manufacturer embarking on a Six Sigma program sets the goal of having true Six Sigma capability for all processes by the end of the month.If their current process capability index on a key metric is less than 2.0 and the process capability ratio is 1.25,what must happen with the process standard deviation?
(Multiple Choice)
4.8/5 (49)
How does SPC help companies implement continuous improvement programs?
(Essay)
4.7/5 (41)
An operator of a filling machine plotted the weights of each bag she filled for three weeks.At the same time,a quality inspector randomly took groups of five bags of the same output and plotted the average weights of the samples.The inspector's sampling distribution will:
(Multiple Choice)
4.9/5 (38)
A process with a target of 25 was used to generate the following data points.Is the process properly centered? Determine the process capability given a USL = 27 and LSL = 18.The standard deviation of the data is 2.712.
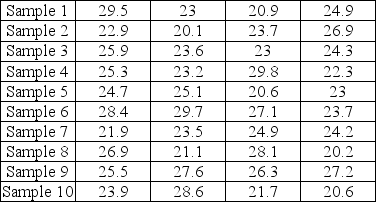
(Essay)
4.9/5 (38)
Historically,the average time to service a customer complaint has been 3 days and the standard deviation has been 0.50 day.Management would like to specify the control limits for an  chart with a sample size of 10 and 3- sigma limits.The UCL for the chart would be:
(Multiple Choice)
4.8/5 (31)
What are any three dimensions of quality and which one accurately describes how you assess education?
(Essay)
4.8/5 (34)
Consumers consider five aspects when defining quality.Which one of the following is least likely to be one of these aspects?
(Multiple Choice)
4.9/5 (37)
Table 5.11
Factors for Calculating Three-Sigma Limits for the  Chart and R-Chart
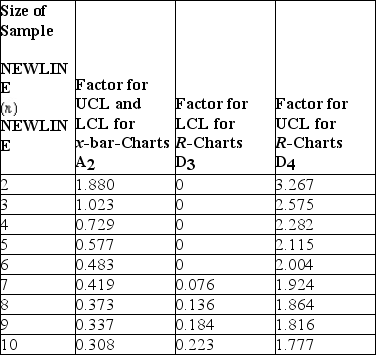 Source: 1950 ASTM Manual on Quality Control of Materials,copyright American Society for Testing Materials.Reprinted with permission.
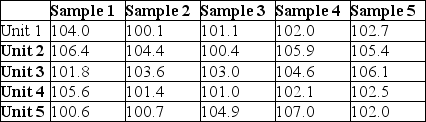
-Thermostats are subjected to rigorous testing before they are shipped to air conditioning technicians around the world.Results from the last five samples are shown in the table.Create control charts that will fully monitor the process and indicate the result of X-bar and R chart analysis.
Source: 1950 ASTM Manual on Quality Control of Materials,copyright American Society for Testing Materials.Reprinted with permission.
-Thermostats are subjected to rigorous testing before they are shipped to air conditioning technicians around the world.Results from the last five samples are shown in the table.Create control charts that will fully monitor the process and indicate the result of X-bar and R chart analysis. 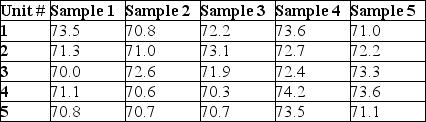
(Multiple Choice)
4.8/5 (39)
Filters
- Essay(0)
- Multiple Choice(0)
- Short Answer(0)
- True False(0)
- Matching(0)