Exam 3: Quality and Performance
Exam 1: Using Operations to Create Value100 Questions
Exam 2: Process Strategy and Analysis245 Questions
Exam 3: Quality and Performance195 Questions
Exam 4: Capacity Planning108 Questions
Exam 5: Constraint Management136 Questions
Exam 6: Lean Systems164 Questions
Exam 7: Project Management140 Questions
Exam 8: Forecasting150 Questions
Exam 9: Inventory Management207 Questions
Exam 10: Operations Planning and Scheduling149 Questions
Exam 11: Resource Planning125 Questions
Exam 12: Supply Chain Design77 Questions
Exam 13: Supply Chain Logistic Networks114 Questions
Exam 14: Supply Chain Integration111 Questions
Exam 15: Supply Chain Sustainability73 Questions
Exam 16: Decision Making107 Questions
Exam 17: Waiting Lines108 Questions
Exam 18: Special Inventory Models53 Questions
Exam 19: Linear Programming86 Questions
Exam 20: Simulation54 Questions
Exam 21: Financial Analysis55 Questions
Exam 22: Acceptance Sampling Plans87 Questions
Exam 23: Measuring Output Rates106 Questions
Exam 24: Learning Curve Analysis51 Questions
Exam 25: Operations Scheduling120 Questions
Exam 26: Layout36 Questions
Select questions type
Table 5.4
The manager of Champion Cooling Company has recently implemented a statistical process control method.The accompanying table shows the results of five different samples of walk-in coolers that were produced in the previous month.
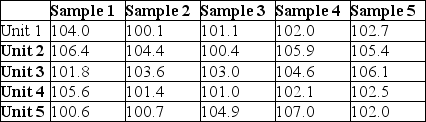 -Using the data in Table 5.4,what is the value of the center line for the chart that monitors performance to target?
(Multiple Choice)
4.8/5  (33)
(33)
The quality control technician grew weary of measuring pistons that came off the line,so he decided to make a fixture that would tell him whether the piston fell within product specifications.The fixture had two holes,one the exact width of the upper specification (24 cm)and one slightly smaller than the lower specification (21 cm).If the piston fit through the smaller hole,it would be too small and therefore rejected.If the piston didn't fit through the larger hole,it was too large and would be rejected.Just to test his idea,he used the traditional measurement system and his new system on the next eight samples.The data and the two charts he constructed are shown below.Why aren't the plotted points forming similar shapes between the two graphs? Evaluate the advantages and disadvantages of his proposed system.
(Essay)
4.8/5 (38)
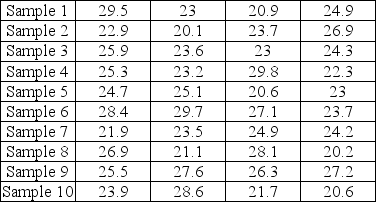
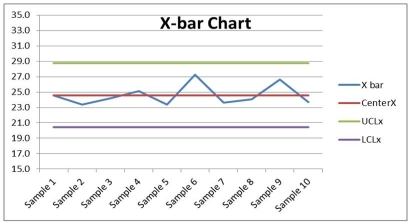
The management of a line that fills cereal boxes wants the box filled at 32.2 ounces.When the process is in control,the standard deviation is .1 ounces.
a.Construct the upper and lower control limits for a 3-sigma x-bar chart using a sample size of five.
b.The results from the last 10 samples follow.Is the process in control? 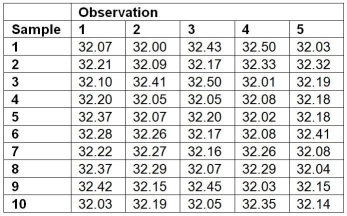
(Essay)
4.9/5 (38)
An acceptable quality level is measured as the proportion of defective items a buyer is willing to tolerate.
(True/False)
4.8/5 (34)
________ refers to how well the product or service performs its intended purpose.
(Essay)
4.9/5 (32)
The upper and lower control limits for a component are 0.150 cm.and 0.120 cm. ,with a process target of .135 cm.The process standard deviation is 0.004 cm.and the process average is 0.138 cm.What is the process capability index?
(Multiple Choice)
4.8/5 (33)
________ costs are associated with preventing defects before they happen.
(Essay)
4.8/5 (43)
Historically,the average time to service a customer complaint has been 3 days and the standard deviation has been 0.50 day.Management would like to specify the control limits for an  chart with a sample size of 10- and 3- sigma limits.Suppose the next sample of 10 yielded the following result: 3.2,2.1,3.6,2.8,3.9,3.5,2.7,4.1,2.6,and 3.3.What conclusion can be drawn?
(Multiple Choice)
4.9/5 (36)
Five samples of size 4 were taken from a process.A range chart was developed that had LCLR = 0 and UCLR = 2.50.Similarly,an average chart was developed with the average range from the five samples,with  = 15.0 and
  = 24.0.The ranges for each of the five samples were 1.75,2.42,2.75,2.04,and 2.80,respectively.The values of the sample average for each sample were 19.5,22.3,17.4,20.1,and 18.9,respectively.What can you tell management from this analysis?
(Multiple Choice)
4.8/5 (41)
Which one of the following statements about quality control is TRUE?
(Multiple Choice)
4.9/5 (37)
Construct a 3-sigma R-chart for the length in centimeters of a part from the following table.What is the upper control limit of your R-chart? 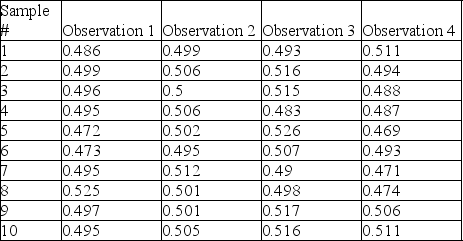
(Multiple Choice)
4.8/5 (35)
MKS Inc. ,produces meter sticks that have a target length of 100 centimeters with upper and lower specification limits of 100.05 and 99.95 centimeters respectively.Their existing process produces meter sticks with an average length of 100.00 centimeters and a standard deviation of 0.015 centimeters.What is their current process capability index?
(Multiple Choice)
4.9/5 (38)
A company measures their Taguchi quality loss function for a product that has a nominal value of 10.The loss function is governed by a parabola,L(x)= k(x-T)2 where T is the nominal value and x is any x-axis value.If the loss curve is as shown in the figure,what is the value of the constant k? 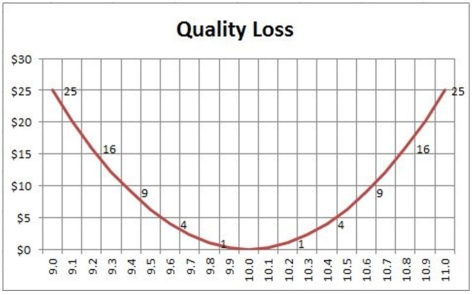
(Essay)
4.9/5 (33)
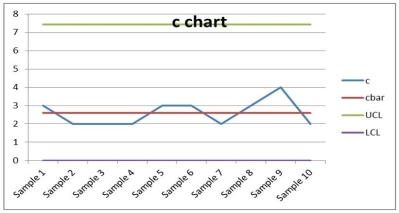
A company is interested in monitoring the number of scratches on Plexiglass panels.The appropriate control chart to use would be:
(Multiple Choice)
4.9/5 (38)
A process is monitored with a control chart.The process is correctly judged to be in-control once the results from the most recent sample are plotted.Therefore,all of the output produced at that time is good.
(True/False)
4.9/5 (38)
Which step of the Six Sigma DMAIC procedure involves identifying data sources and preparing a data collection plan?
(Multiple Choice)
4.8/5 (40)
A manufacturer embarking on a Six Sigma program sets the goal of having true Six Sigma capability for all processes by the end of the month.If their current process capability index on a key metric is less than 2.0 and the process capability ratio is 1.70,what must happen with the process standard deviation?
(Multiple Choice)
4.9/5 (46)
Filters
- Essay(0)
- Multiple Choice(0)
- Short Answer(0)
- True False(0)
- Matching(0)